6 Key Project Management Metrics to Ensure Success
Success isn't just a goal; it's a constant battle against time, resources, and unforeseen challenges. The challenge of delivering projects on time can feel like an uphill climb, leaving even the most proficient project managers looking for effective solutions.
According to data from Smartsheet, 91% of project management professionals acknowledge that their organizations encounter significant challenges in project management.
But worry not, project management metrics can be your guiding light amidst this chaos. These metrics are quantifiable measures used to track various aspects of a project's performance and progress, identify areas for improvement, and make informed decisions.
Without them, it will really be difficult for you to ensure project success. Keep reading this post to learn what the key project metrics are and how you can implement them within your scope.
Major Types of Project Management Metrics

Project metrics include schedule metrics (like SV and SPI), cost metrics (like CV and CPI), quality metrics (like Defect Density and Customer Satisfaction Score), resource metrics (like Resource Utilization Rate and Allocation), and more. Let's dive into the detailed discussion.
1. Cost Management Metrics
Cost management metrics are quantitative measures that assess and control the financial aspects of a project throughout the project management lifecycle. These metrics provide insights into cost performance, budget adherence, resource utilization, and overall project financial health. Let's have a look at the common financial project metrics.
a) Cost Variance (CV)
Cost Variance (CV) measures the variance between the actual costs incurred and the budgeted costs for completed work.
Formula: CV = Earned Value (EV) - Actual Cost (AC)Example: Let's say the budgeted cost for a project task is $10,000, and the actual cost incurred to complete the task is $8,000.
Cost Variance (CV) = EV – AC
CV = $10,000 – $8,000
CV = $2,000 (positive value indicates that the project is under budget)
b) Cost Performance Index (CPI)
The Cost Performance Index (CPI) measures cost performance efficiency by comparing the earned value to the actual cost incurred.
Formula: CPI = EV / ACExample: Continuing from the previous example, let's calculate:
Cost Performance Index (CPI) = EV / AC
CPI = $10,000 / $8,000
CPI = 1.25 (a CPI greater than 1 indicates that the project is performing better than planned in terms of cost efficiency)
c) Earned Value (EV)
Earned Value (EV) represents the value of completed work expressed in monetary terms, based on the project's planned budget.
Formula: EV = Planned % Complete * Budget at Completion (BAC)Example: Suppose a project task was planned to be 50% complete by the end of the month, and the total budget for the task is $20,000.
EV = 50% * $20,000
EV = $10,000 (indicating that $10,000 worth of work has been completed according to the project plan)
2. Schedule Performance Metrics (Deadline Adherence)

These are the quantitative measures you can use to evaluate the efficiency and effectiveness of schedule management in a project. These metrics help calculate whether project tasks are being completed according to the planned schedule, identify schedule variances, and track progress toward project milestones and deadlines.
a) Schedule Variance (SV)
Schedule Variance (SV) measures the difference between the earned value (EV) and the planned value (PV) for completed work, indicating whether tasks are ahead of or behind schedule.
Formula: SV = EV - PVExample: Suppose a project task was planned to have an earned value (EV) of $8,000 by a certain date, but the actual earned value is $6,000. The planned value (PV) for the task was $7,000. The Schedule Variance would be calculated as follows:
Schedule Variance (SV) = EV – PV
SV = $6,000 – $7,000
SV = -$1,000 (a negative value indicates that the task is behind schedule by $1,000)
b) Schedule Performance Index (SPI)
The Schedule Performance Index (SPI) measures the efficiency of schedule performance by comparing the earned value (EV) to the planned value (PV).
Formula: SPI = EV / PVExample: Continuing from the previous example, let's calculate:
Schedule Performance Index (SPI) = EV / PV
SPI = $6,000 / $7,000
SPI ≈ 0.857 (an SPI less than 1 indicates that the task is behind schedule)
c) Milestone Achievement Rate
The Milestone Achievement Rate measures the percentage of project milestones completed on time compared to the total number of milestones planned.
Formula: (Number of milestones achieved on time / Total number of planned milestones) * 100%Example: If a project has 10 planned milestones and 7 of them are completed on time, the Milestone Achievement Rate would be calculated as follows:
Milestone Achievement Rate = (7 / 10) * 100%
Milestone Achievement Rate = 70% (indicating that 70% of milestones were achieved on time)
3. Quality Management Metrics
Quality management metrics assess the quality of project deliverables, processes, and outcomes. These metrics help project managers evaluate the effectiveness of quality assurance processes, identify areas for improvement, and ensure that project objectives are met with high standards of quality.
a) Defect Density
Defect Density measures the number of defects identified per unit of work or product, indicating the quality of the deliverable.
Formula: Defect Density = Number of defects / Size of deliverable (e.g., lines of code, pages of documentation)Example: If a software application has 1000 lines of code and 50 defects are identified, the Defect Density would be calculated as follows:
Defect Density = 50 defects / 1000 lines of code
Defect Density = 0.05 defects per line of code
b) Customer Satisfaction Score (CSAT)
Customer Satisfaction Score (CSAT) evaluates the level of satisfaction among project stakeholders, such as clients, end-users, or internal stakeholders.
Formula: CSAT = (Number of satisfied respondents / Total number of respondents) * 100%Example: After completing a project, a survey is conducted among clients, and 80 out of 100 respondents express satisfaction with the project outcomes. The CSAT would be calculated as follows:
CSAT = (80 satisfied respondents / 100 total respondents) * 100%
CSAT = 80%
c) Percentage of Deliverables Meeting Quality Standards
Percentage of Deliverables Meeting Quality Standards measures the proportion of project deliverables that meet predefined quality criteria or standards.
Formula: (Number of deliverables meeting quality standards / Total number of deliverables) * 100%Example: If a project has 20 deliverables, and 16 of them meet the established quality standards, the Percentage of Deliverables Meeting Quality Standards would be calculated as follows:
Percentage of Deliverables Meeting Quality Standards = (16 / 20) * 100%
Percentage of Deliverables Meeting Quality Standards = 80%
4. Resource Utilization Metrics

Resource utilization metrics are measures used to assess how effectively resources are utilized within a project. These metrics help project managers understand how efficiently resources such as human capital, equipment, or funds are being utilized to accomplish project objectives.
5. Risk Management Metrics
Risk management metrics help evaluate and monitor the effectiveness of risk management processes within a project. These metrics provide insights into the level of risk exposure, the success of risk mitigation efforts, and the overall risk profile of the project.
a) Risk Exposure
Risk Exposure quantifies the potential impact of identified risks on project objectives, considering both the probability of occurrence and the severity of impact.
Formula: Risk Exposure = Probability of Occurrence * Impact Severityb) Risk Response Effectiveness
Risk Response Effectiveness evaluates the success of implemented risk response strategies in mitigating or controlling identified risks.
Formula: Risk Response Effectiveness = (Initial Risk Exposure - Residual Risk Exposure) / Initial Risk Exposure * 100%c) Number of Identified Risks vs. Resolved Risks
Number of Identified Risks vs. Resolved Risks measures the ratio of identified risks that have been effectively resolved or mitigated compared to the total number of risks identified.
Formula: Number of Resolved Risks / Total Number of Identified Risks * 100%6. Stakeholder Satisfaction Metrics
A stakeholder engagement survey is conducted periodically. In this method, stakeholders rate their level of engagement on a scale of 1 to 5. The average rating across all stakeholders provides the Stakeholder Engagement Index.
A survey is conducted to evaluate stakeholders' perceptions of project communication effectiveness, with questions covering clarity, timeliness, and relevance of communication. The average score provides the Communication Effectiveness Score.
Another stakeholder metric is Stakeholder Feedback Analysis. Feedback received from stakeholders through surveys, interviews, or feedback forms is categorized, analyzed, and summarized to identify common themes, trends, and actionable insights for improving stakeholder satisfaction.
Why Project Metrics Matter in Your Organization

Let's talk about why project metrics matter in an organization.
Facilitating informed decision-making: Project metrics are like your trusted advisor when it comes to decision-making. They give you cool and hard facts you need to make informed choices that steer your projects in the right direction.
Monitoring progress and performance: When it comes to keeping tabs on how things are going, project metrics help you monitor progress and performance in real-time, so you always know where you stand and what needs attention.
Identifying areas for improvement: Project metrics also expose areas where you can do better. They pinpoint areas for improvement, whether it's streamlining processes or fine-tuning strategies, so you can constantly up your game.
Ensuring resource efficiency: Project metrics ensure you're using resources wisely. By keeping an eye on metrics like resource utilization, you can optimize resources and avoid waste.
Enhancing stakeholder communication and satisfaction: Last but not least, project metrics are all about keeping everyone in the loop and happy. By communicating performance metrics effectively, you can build trust with stakeholders and ensure their satisfaction every step of the way.
Also read: Effective Project Management Tips To Be A Better Project Manager
Difference between project metrics and project KPIs
While project metrics focus on tracking various project variables and performance indicators, project KPIs are more strategic in nature. Project KPIs offer a high-level overview of project success, directly tied to organizational goals, guiding decision-making. Here's a comparison table highlighting the key differences between project metrics and project KPIs:
| Aspect | Project Metrics | Project KPIs |
|---|---|---|
| Definition | Quantitative measures track project performance and progress. | Key performance indicators align with strategic objectives and goals. |
| Purpose | Monitor and assess various aspects of project performance, such as cost, schedule, quality, and resource utilization. | Measure the achievement of specific objectives and goals critical to project success. |
| Focus | Focus on tracking specific project variables and metrics related to project execution. | Focus on strategic objectives and critical success factors that drive project success. |
| Precision level | Can be granular and detailed, covering multiple aspects of project performance. | Typically broader in scope, reflecting overall project performance. |
| Timeframe | Can be measured at various intervals throughout the project lifecycle. | Usually measured over the entire project lifecycle, although may include shorter-term targets. |
| Alignment with goals | May not always directly align with strategic objectives and organizational goals. | Directly aligned with strategic objectives and organizational goals. |
| Examples | – Cost variance | – On-time delivery rate |
| – Schedule performance index | – Customer satisfaction score | |
| – Resource utilization rate | – Return on investment | |
| – Defect density | – Net promoter score |
How to Implement Project Success Metrics for Your Team Management

By incorporating project success metrics into your team management approach, you can enhance performance tracking, improve decision-making, and increase the likelihood of achieving project objectives. Let's learn how you
1. Define Clear Project Objectives and Key Success Factors
You should start by defining clear project objectives and identifying critical success factors. This provides a roadmap for your team, guiding their efforts towards desired outcomes. For example, if the objective is to launch a new product, key success factors may include meeting the launch deadline, achieving a certain level of market penetration, and ensuring customer satisfaction.
2. Select Relevant Metrics Aligned With Project Goals
Next, select relevant metrics that directly align with the project goals and objectives. Choose indicators that accurately measure progress and performance in areas critical to project success. If one of the project goals is to improve customer satisfaction, relevant metrics may include Net Promoter Score (NPS), customer retention rate, and customer feedback ratings.
3. Establish Measurement Methods and Baselines
Once you've identified the metrics, establish measurement methods and baselines to ensure consistency and accuracy. Define how each metric will be measured, collected, and analyzed throughout the project lifecycle. For instance, if you're tracking project costs, establish a baseline budget and use tools like project management software or spreadsheets to track actual expenses against the budget.
4. Utilize Tracking Tools and Systems

Utilize tracking tools and systems to streamline the monitoring process and capture relevant data efficiently. Whether it's project management software, spreadsheets, or custom-built dashboards, ensure that you have the necessary tools in place to track progress effectively.
The project management software market is not just growing. It's booming. By 2030, the market is projected to hit a staggering $15.08 billion. That's a growth rate of 10.68% from 2022 to 2030.
Zion Market Research
You can use project management software like WP Project Manager, Asana, or Trello to track project progress, tasks, and milestones, allowing team members to update their progress in real time.
5. Regularly Monitor and Analyze
Regularly monitor and analyze the project metrics to stay informed about progress and identify any deviations from the plan. This allows you to take timely corrective actions, address issues, and capitalize on opportunities to keep the project on track.
Use WP Project Manager to Integrate Project Metrics with Ease
If you run a WordPress website, WP Project Manager can be your ally in implementing project management metrics for your organization. This plugin offers a user-friendly interface and powerful features to streamline project management tasks, collaboration, and communication within your team.

With WP Project Manager Pro, you can easily organize projects, assign tasks, track progress, and communicate with team members—all from within your WordPress dashboard. WP Project Manager provides essential features to implement project metrics effectively:
- Task Management: Create and assign tasks to team members, set deadlines, and track task progress.
- Milestones: Set project milestones to track key achievements and monitor project progress.
- Time Tracking: Track the time spent on tasks and projects to measure productivity and resource utilization.
- Gantt Charts: Visualize project timelines, dependencies, and task progress with interactive Gantt charts.
- Kanban Board: The Kanban board allows you to visualize tasks as cards arranged in columns representing different stages of a workflow (e.g., To Do, In Progress, Done).
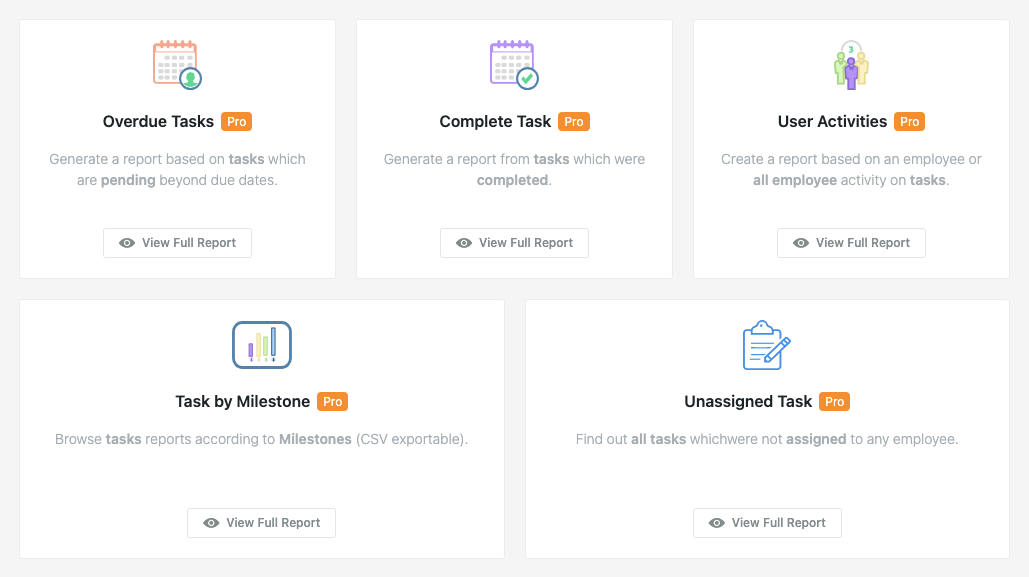
- Reporting and Analytics: Generate reports and analytics to monitor project performance, identify trends, and make data-driven decisions.
- Dashboard: Here, you can get a quick overview of project progress, upcoming deadlines, and task assignments. The dashboard provides at-a-glance information to keep you informed and updated on the status of your projects.
Whether you're managing small projects or large-scale initiatives, WP Project Manager scales with your needs. Using this tool, you can integrate project metrics effortlessly into your WordPress website, streamline project management workflows, and drive project success.
Apply Effective Project Metrics to Ensure Success
As we reach the conclusion of our exploration into project management metrics, it's evident that these quantifiable measures serve as invaluable tools for any project manager. From tracking progress to managing risks and stakeholder satisfaction, these project metrics help in navigating the complexities of project management with confidence.
It's essential to not only understand their significance but also to apply them effectively in your projects. So, it's your turn to embrace the power of project management metrics and let them direct you toward your destination. With the right metrics at your disposal, success is not just a possibility—it's a certainty.

