


A Beginners Guide to Google Data Studio (Looker Studio) for Marketers
Data is a blessing for any marketer when it is meaningful and understandable. However, turning web data into meaningful insights can be a complex process. Fortunately, Google Data Studio, data visualization from Google can save you a lot of time and effort.
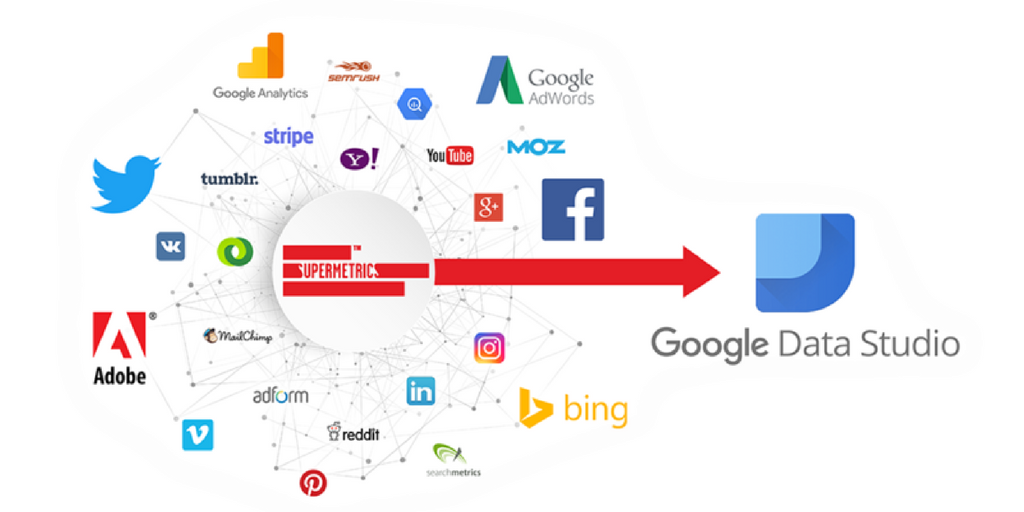
If you ask someone how they collect and utilize their website data, the most common answer would be Google Analytics. You will also get some other answers like SEMRush, Google Ads, Bing Ads, DoubleClick Search, YouTube Analytics, etc.
Luckily, Google Data studio (Looker Studio) can pull data from all these sources and lets you create meaningful dashboards. You can create engaging reports within minutes without analyzing bottomless excel files and spreadsheets.
Note: At Google Cloud Next '22, it was announced that Google Data Studio will now be known as Looker Studio. The rebrand follows on from Google acquiring data analytics start-up Looker for $2.6B a few years ago.
In this piece of content, we will discuss in-depth on Google's free data visualization and business intelligence reporting tool including –
- Why marketers need Google Data Studio and Google Data Studio Marketing Dashboard
- How to create dashboards and transform your data into informative reports
- And how to customize and analyze your reports

So, without any further ado let's find out how you can utilize Google Data Studio to the fullest for measuring the results of your marketing funnels.
What is Google Data Studio (Looker Studio): An Overview
As said above, Google Data Studio is one of the most comprehensive web data analysis and reporting tools. It is a free-to-use drag-and-drop dashboard builder. Google launched it in 2016 and released the beta version in 2018.
Data Studio is very easy to use and has a simple interface. You can add charts easily and create reports on the fly. The best part is – you won't need any technical knowledge!

You can also import web and business data from different popular data sources. This helps you to build beautiful dashboards with interactive reports. Most importantly, you will be able to display and share the insights that you have generated.
How Google Data Studio (Looker Studio) Helps Your Marketing Efforts
As a marketer, you constantly work with funnels and consumer behavior that helps you to understand your users' psychology. For this, the most suitable and easily usable tool is non-other than Google Analytics.
Google Analytics is very complex while you are using it as a reporting tool, Data Studio can save you from a pile of work and analyzing thousands of data in spreadsheets.
Now, let's find out the reasons for using Google Data Studio–
- Seamlessly Integrates with a Variety of Data Sources
- It's FREE!
- Creates Amazing Dashboards with Insights
- User-friendly and Intuitive
- Easily Shareable Among Team
- It's a Google Product
1. Seamlessly Integrates with a Variety of Data Sources
Google Data Studio can integrate data from different popular sources. You can use those data inside the Data Studio for analysis and reporting purposes.
There are tons of tools from different CRMs to Google or Facebook Analytics that we use regularly and get lost an immense amount of data. Also, we often cannot figure out what's important for our business and what's not.
Google Data Studio easily integrates with all those tools and helps to weed out the meaningful insights that we really need.
2. It's FREE!
The beta version of Google Data Studio is completely free. You can use it anytime you want. This is one of the main reasons why people choose it over alternatives like Power BI or Tableau.
3. Creates Amazing Dashboards with Insights
As you can easily weed out information using Google Data Studio, you need to visualize them in a meaningful format. This is where dashboards come in. With the Data Studio, you can dashboards that help you understand the story that your data is telling and also the actions that you must take.
The dashboards that Google Data Studio creates, let you get quick answers to the question that you have about your business or website and make the right marketing decisions when needed.
4. User-friendly and Intuitive
Everyone likes a user-friendly and simple tool. Google Data Studio fits properly in that criteria. It's intuitive and you won't need much time to get a grip of this tool. It can create dashboards very quickly and you can learn the basics within a few minutes.
It’s simple and intuitive, so it doesn’t take long to get the hang of the basics. It’s very quick to create dashboards once you know the basics if you are already using other Google products.
5. Easily Shareable Among Team
One of the most important features that Google Data Studio provides is that – it lets you share your findings including charts, reports, your company brand dashboards with your team; just like Google Drive files. This makes sharing and collaboration easier than ever inside a super easy reporting tool.
6. It's a Google Product
Finally, as you already know – it's a Google Product!
How can it be bad? It contains the scalability, reliability and support you can only get from Google.
That being said, Google Data Studio can be considered as the ultimate data visualization and reporting tool for any marketer.
How to Utilize Google Data Studio Marketing Dashboard- 6 Easy Steps
Here is simple and easy crash course of Google Data Studio that can change the way you analyze your marketing data:
- Log in to Google Data Studio
- Create Your Marketing Report
- Integrate Your Business or Website Data
- Customize Your Report
- Create Data Visualizations that You Can Understand
- Easily Share Your Dashboard
Now, let's get into the details!
Step 1: Log in to Google Data Studio
Like Google Analytics, you need to sign in with your Google account to use the Data Studio. Navigate to – DataStudio.Google.com
Step 2: Create Your Marketing Report
From the Reports section on the Home page, click on the “+” button to create a new blank report.
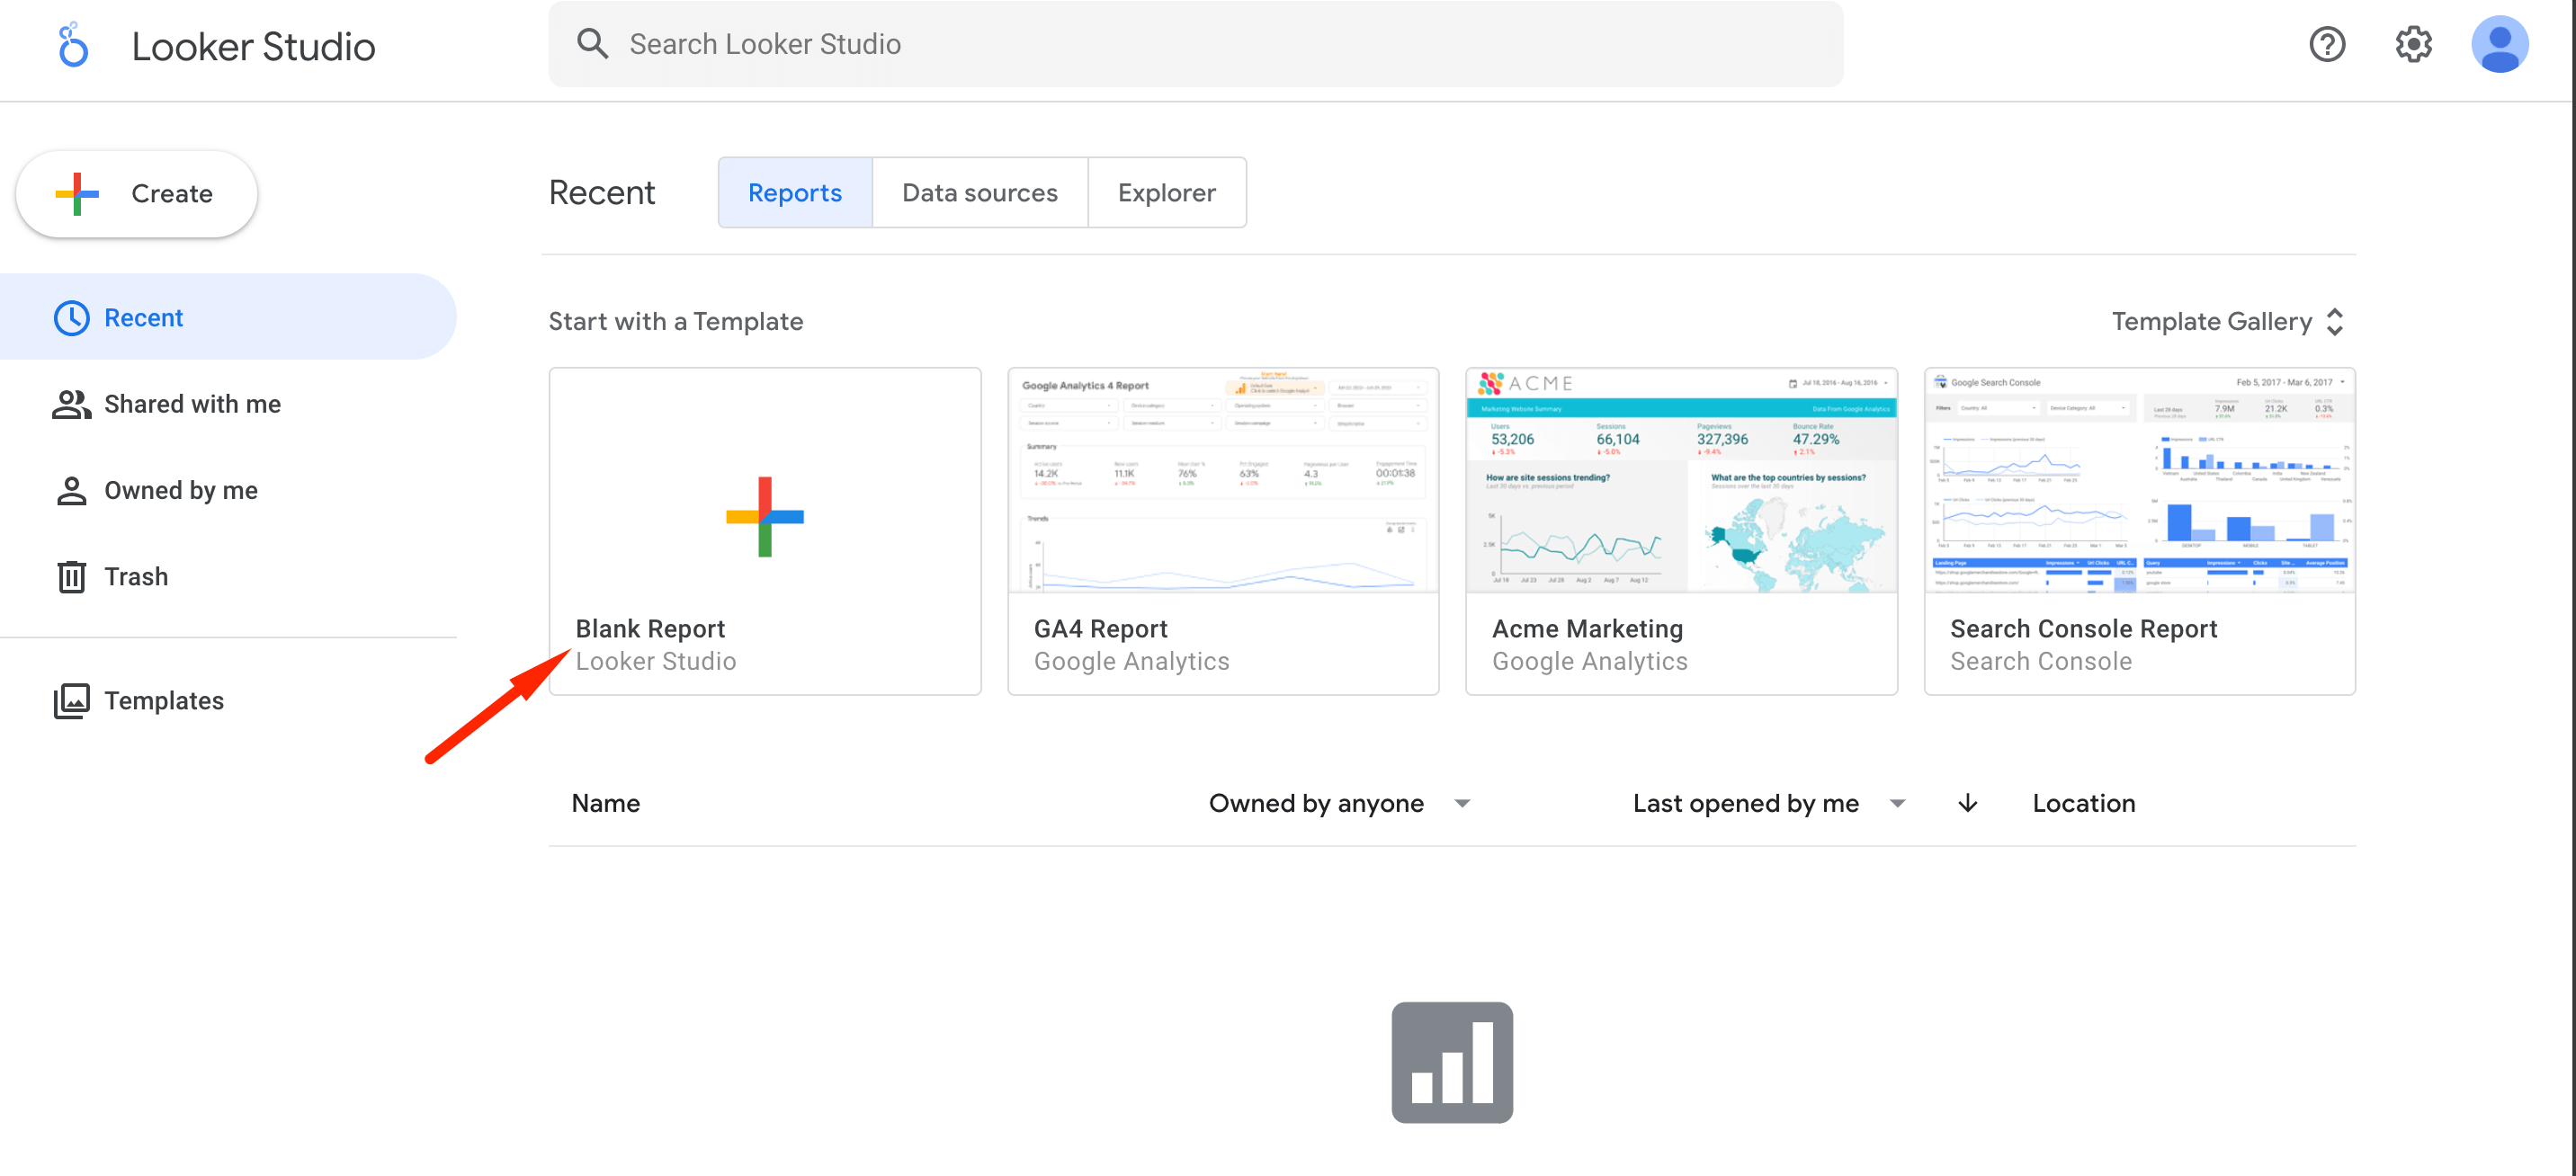
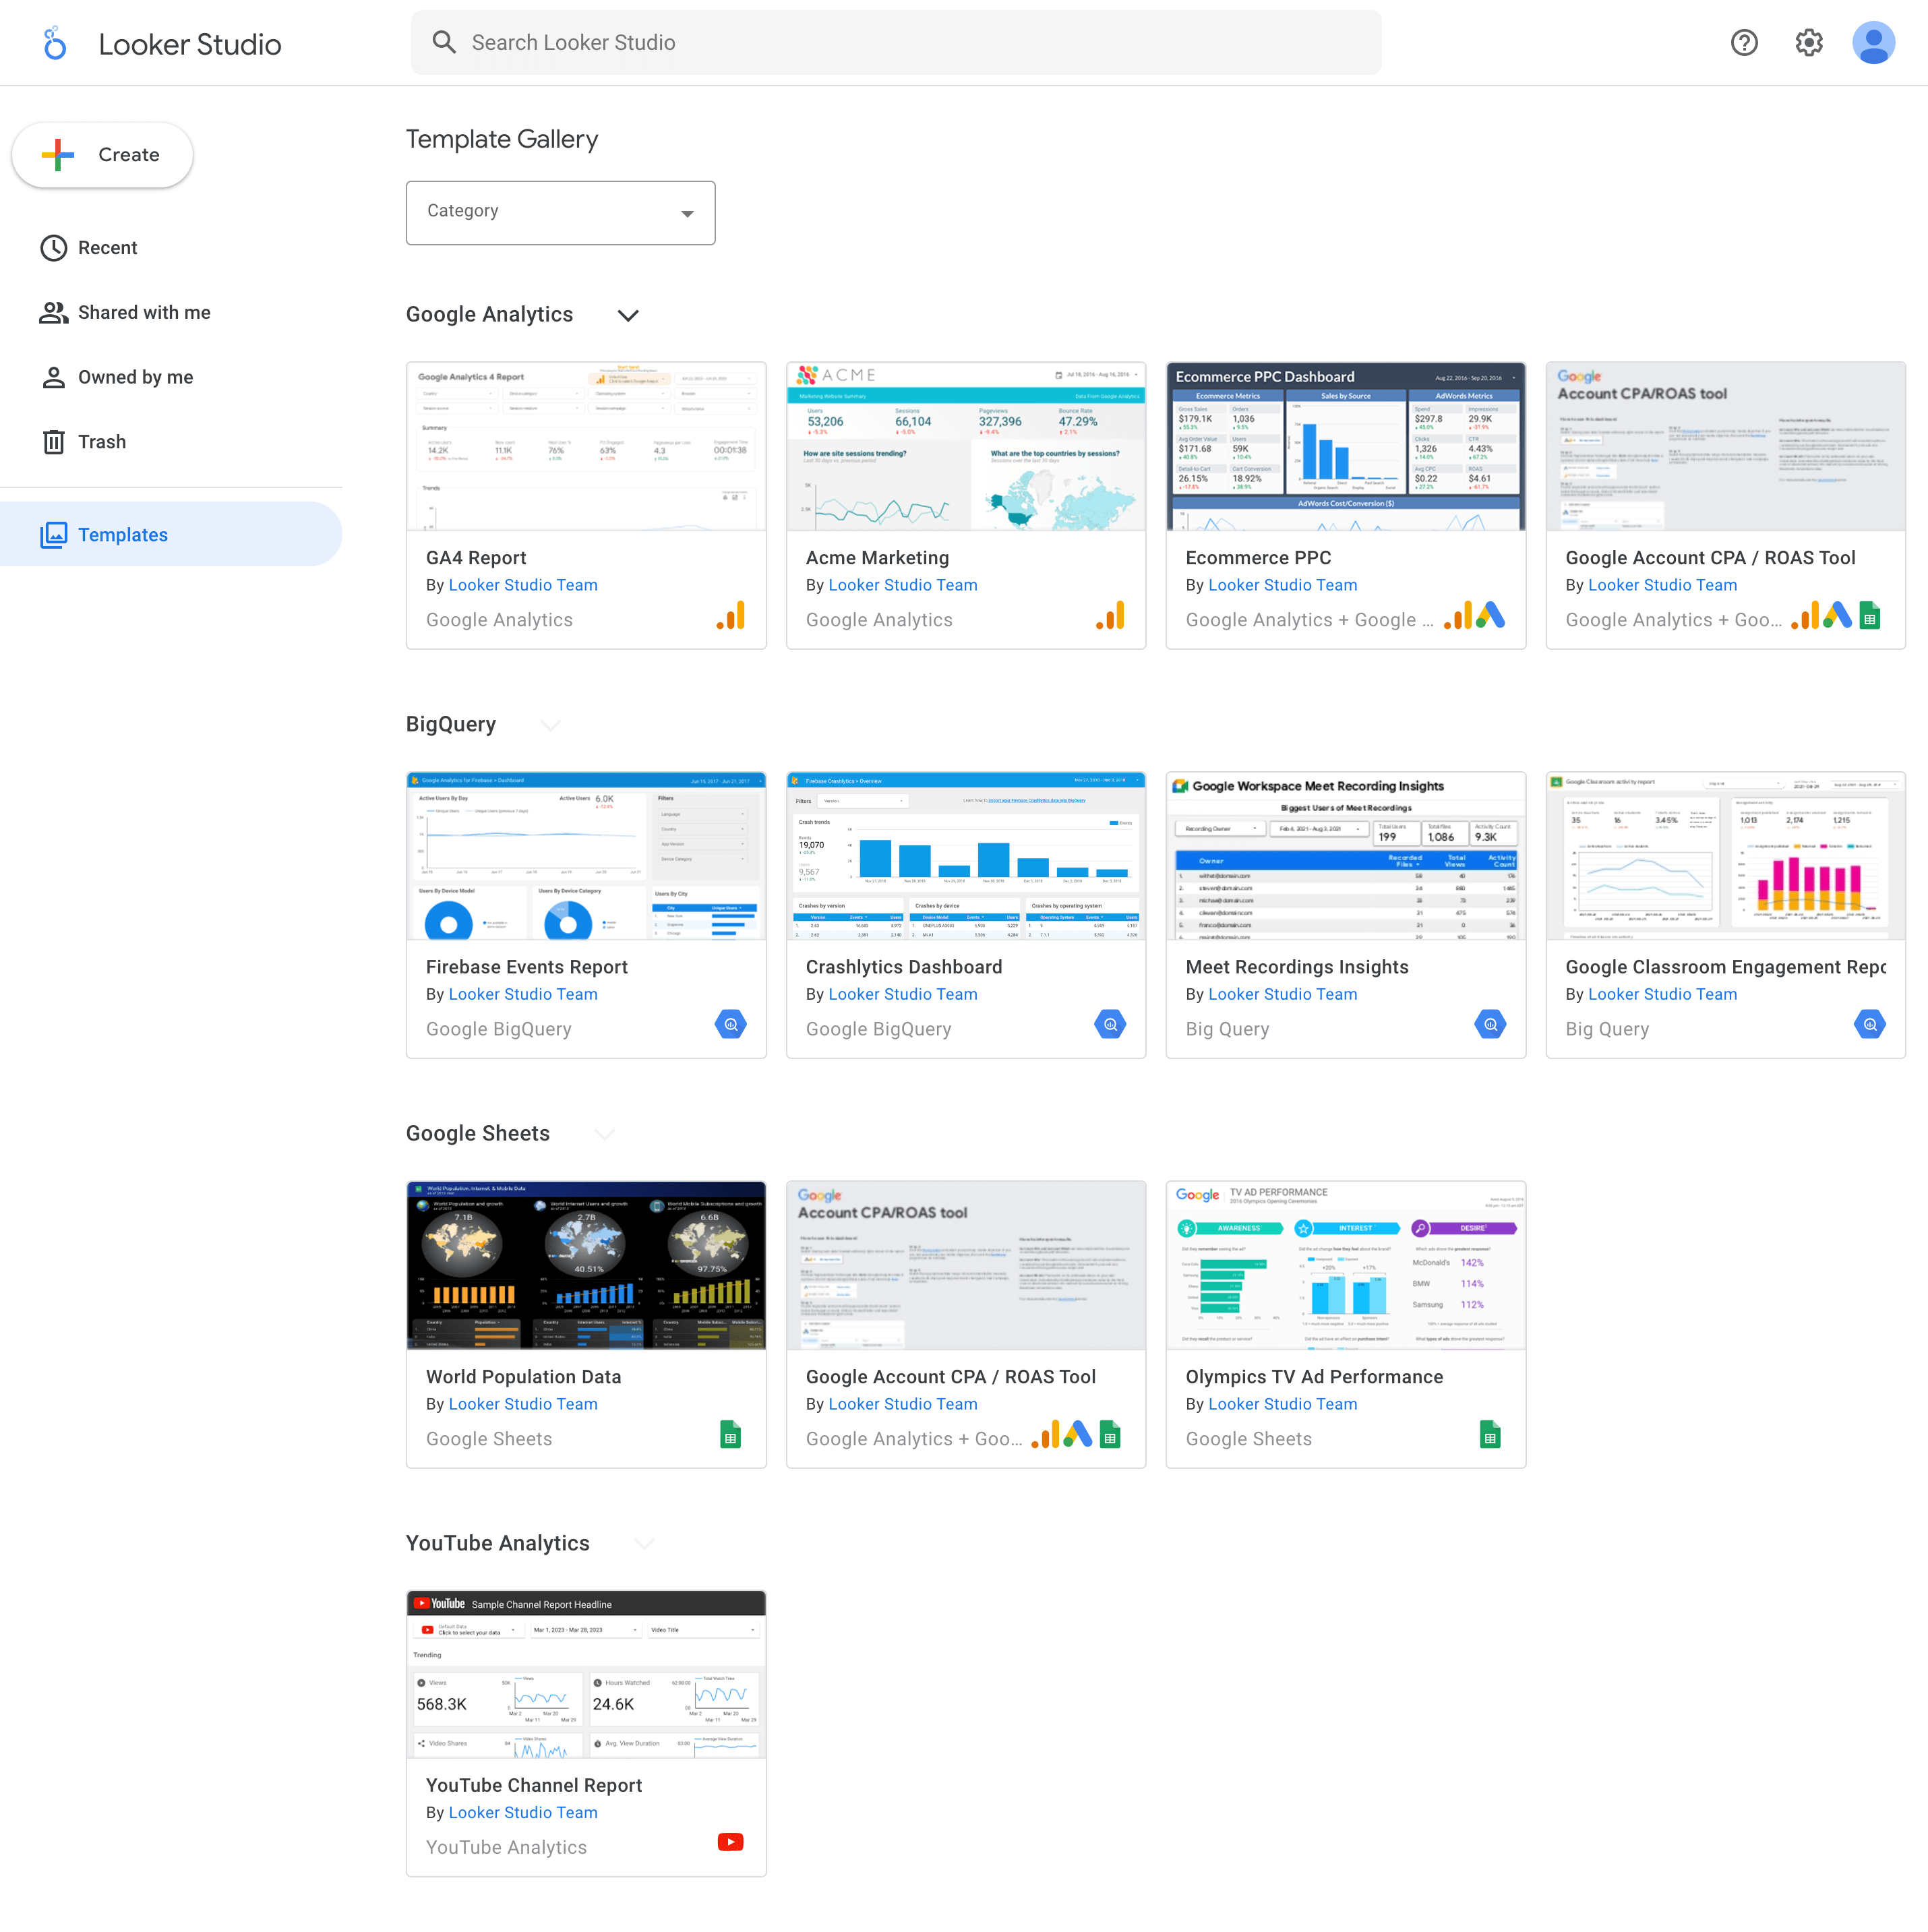
You can also create reports from pre-built templates. Just click on the template that you want, it will be automatically created.
Step 3: Integrate Your Business or Website Data
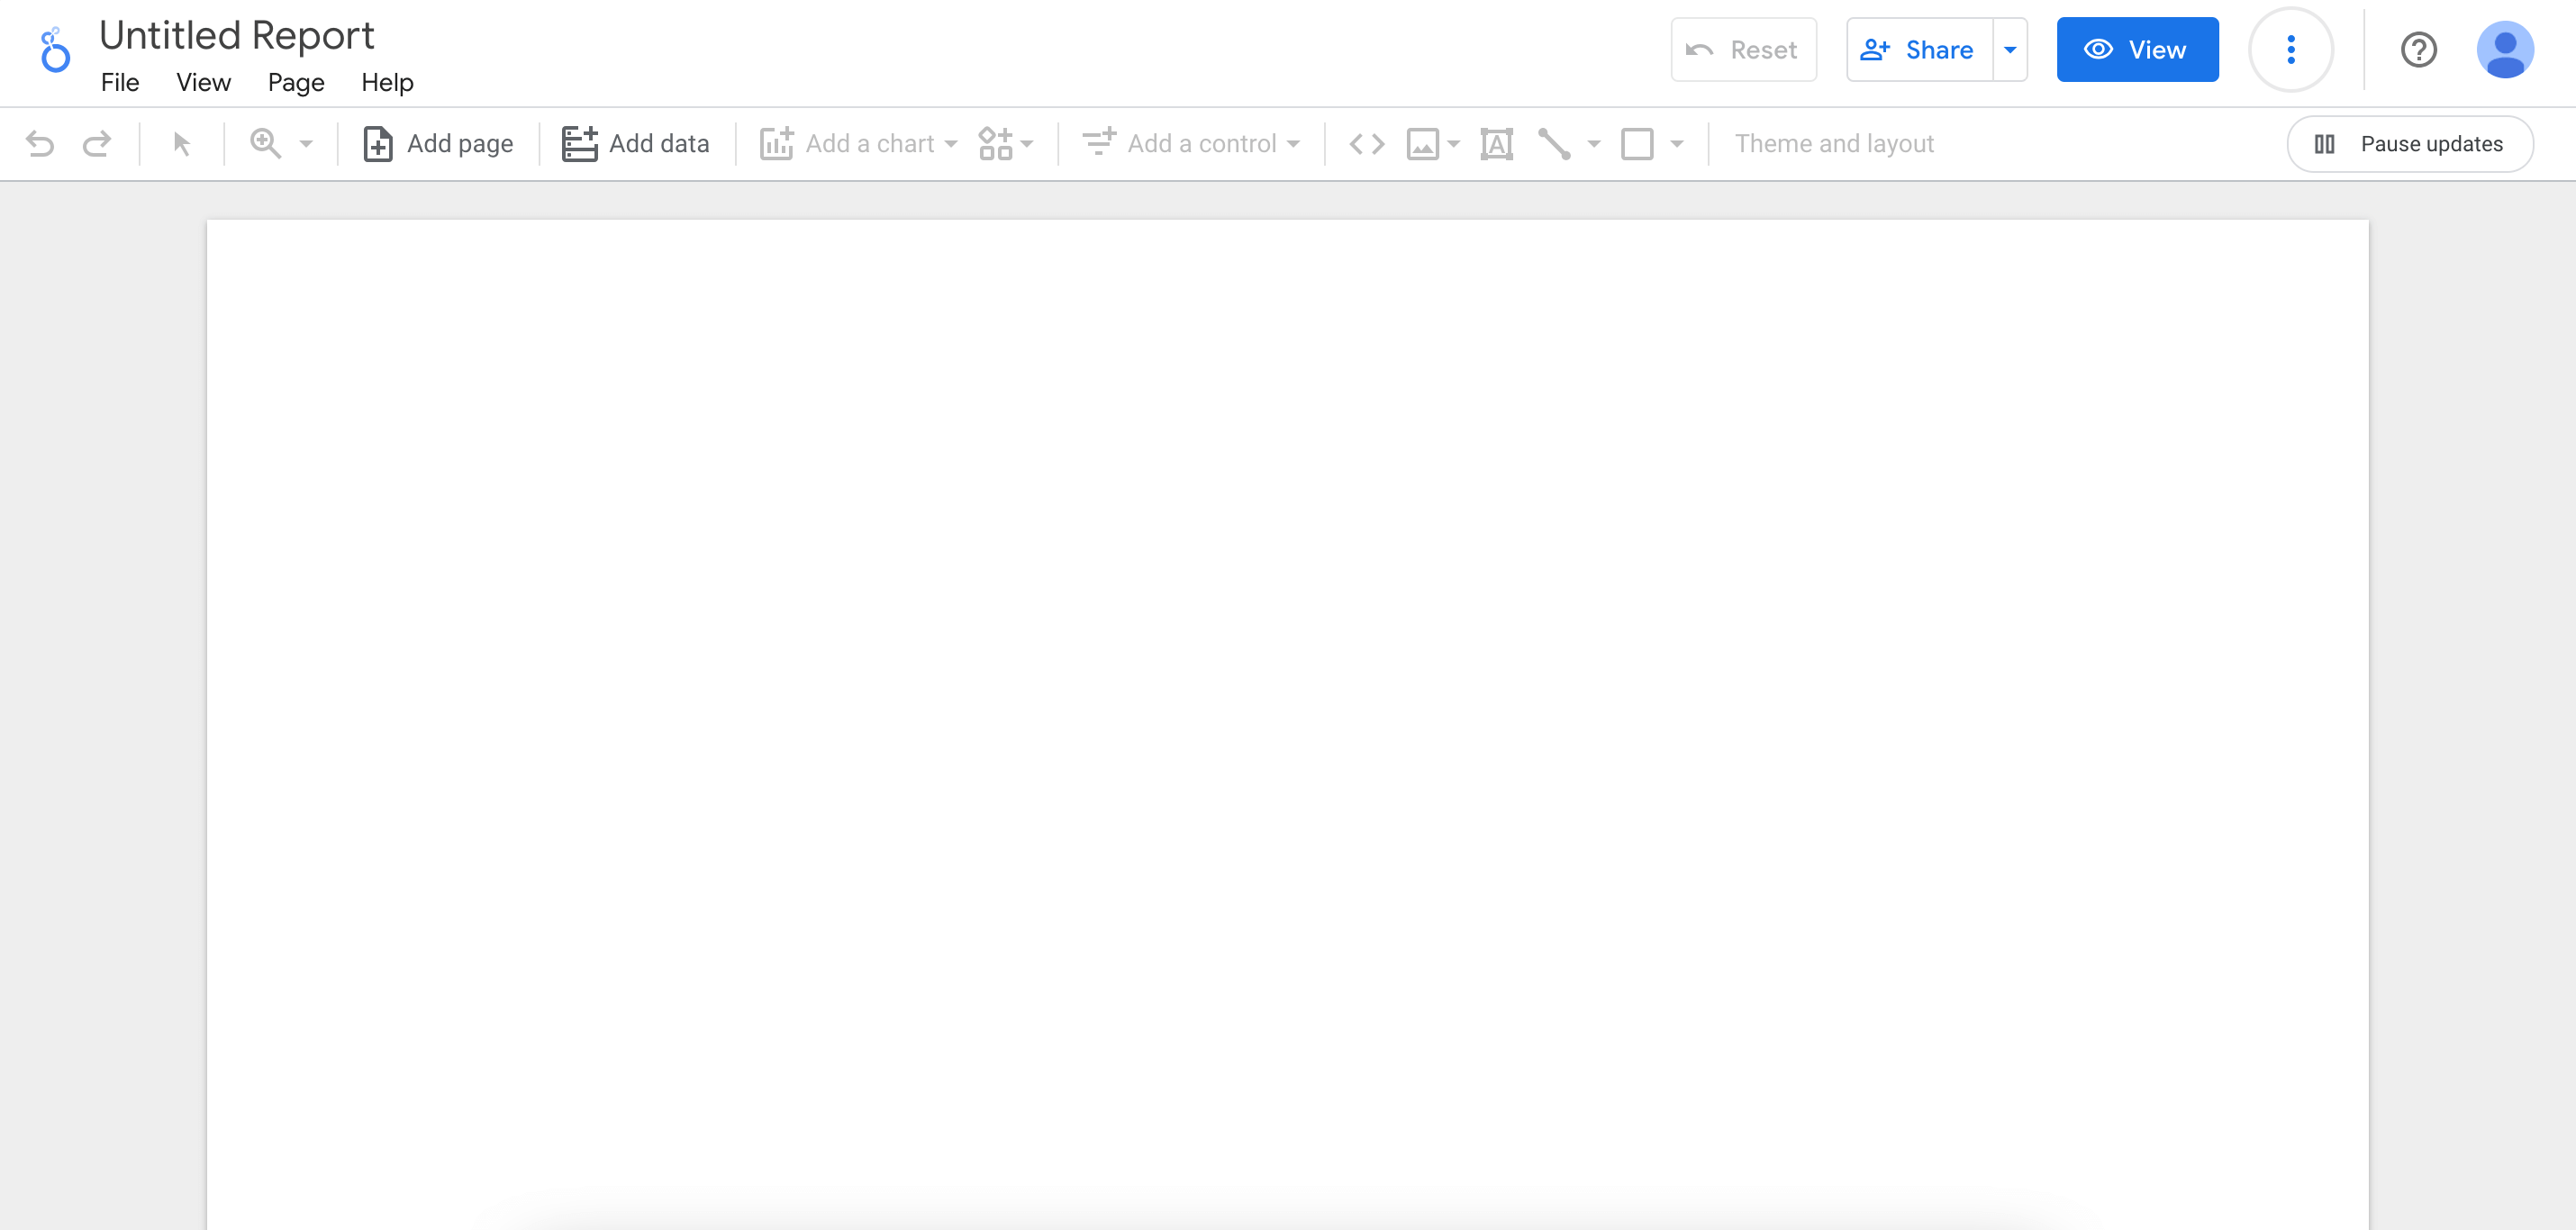
A new untitled report will be created. At this step, you will need to add a data source. The best way is to integrate with other tools, you can even upload your data manually.
To select a data source, click on the available ones or create a new data source with the button below.
Google supports 18 sources that you can easily connect with your report.
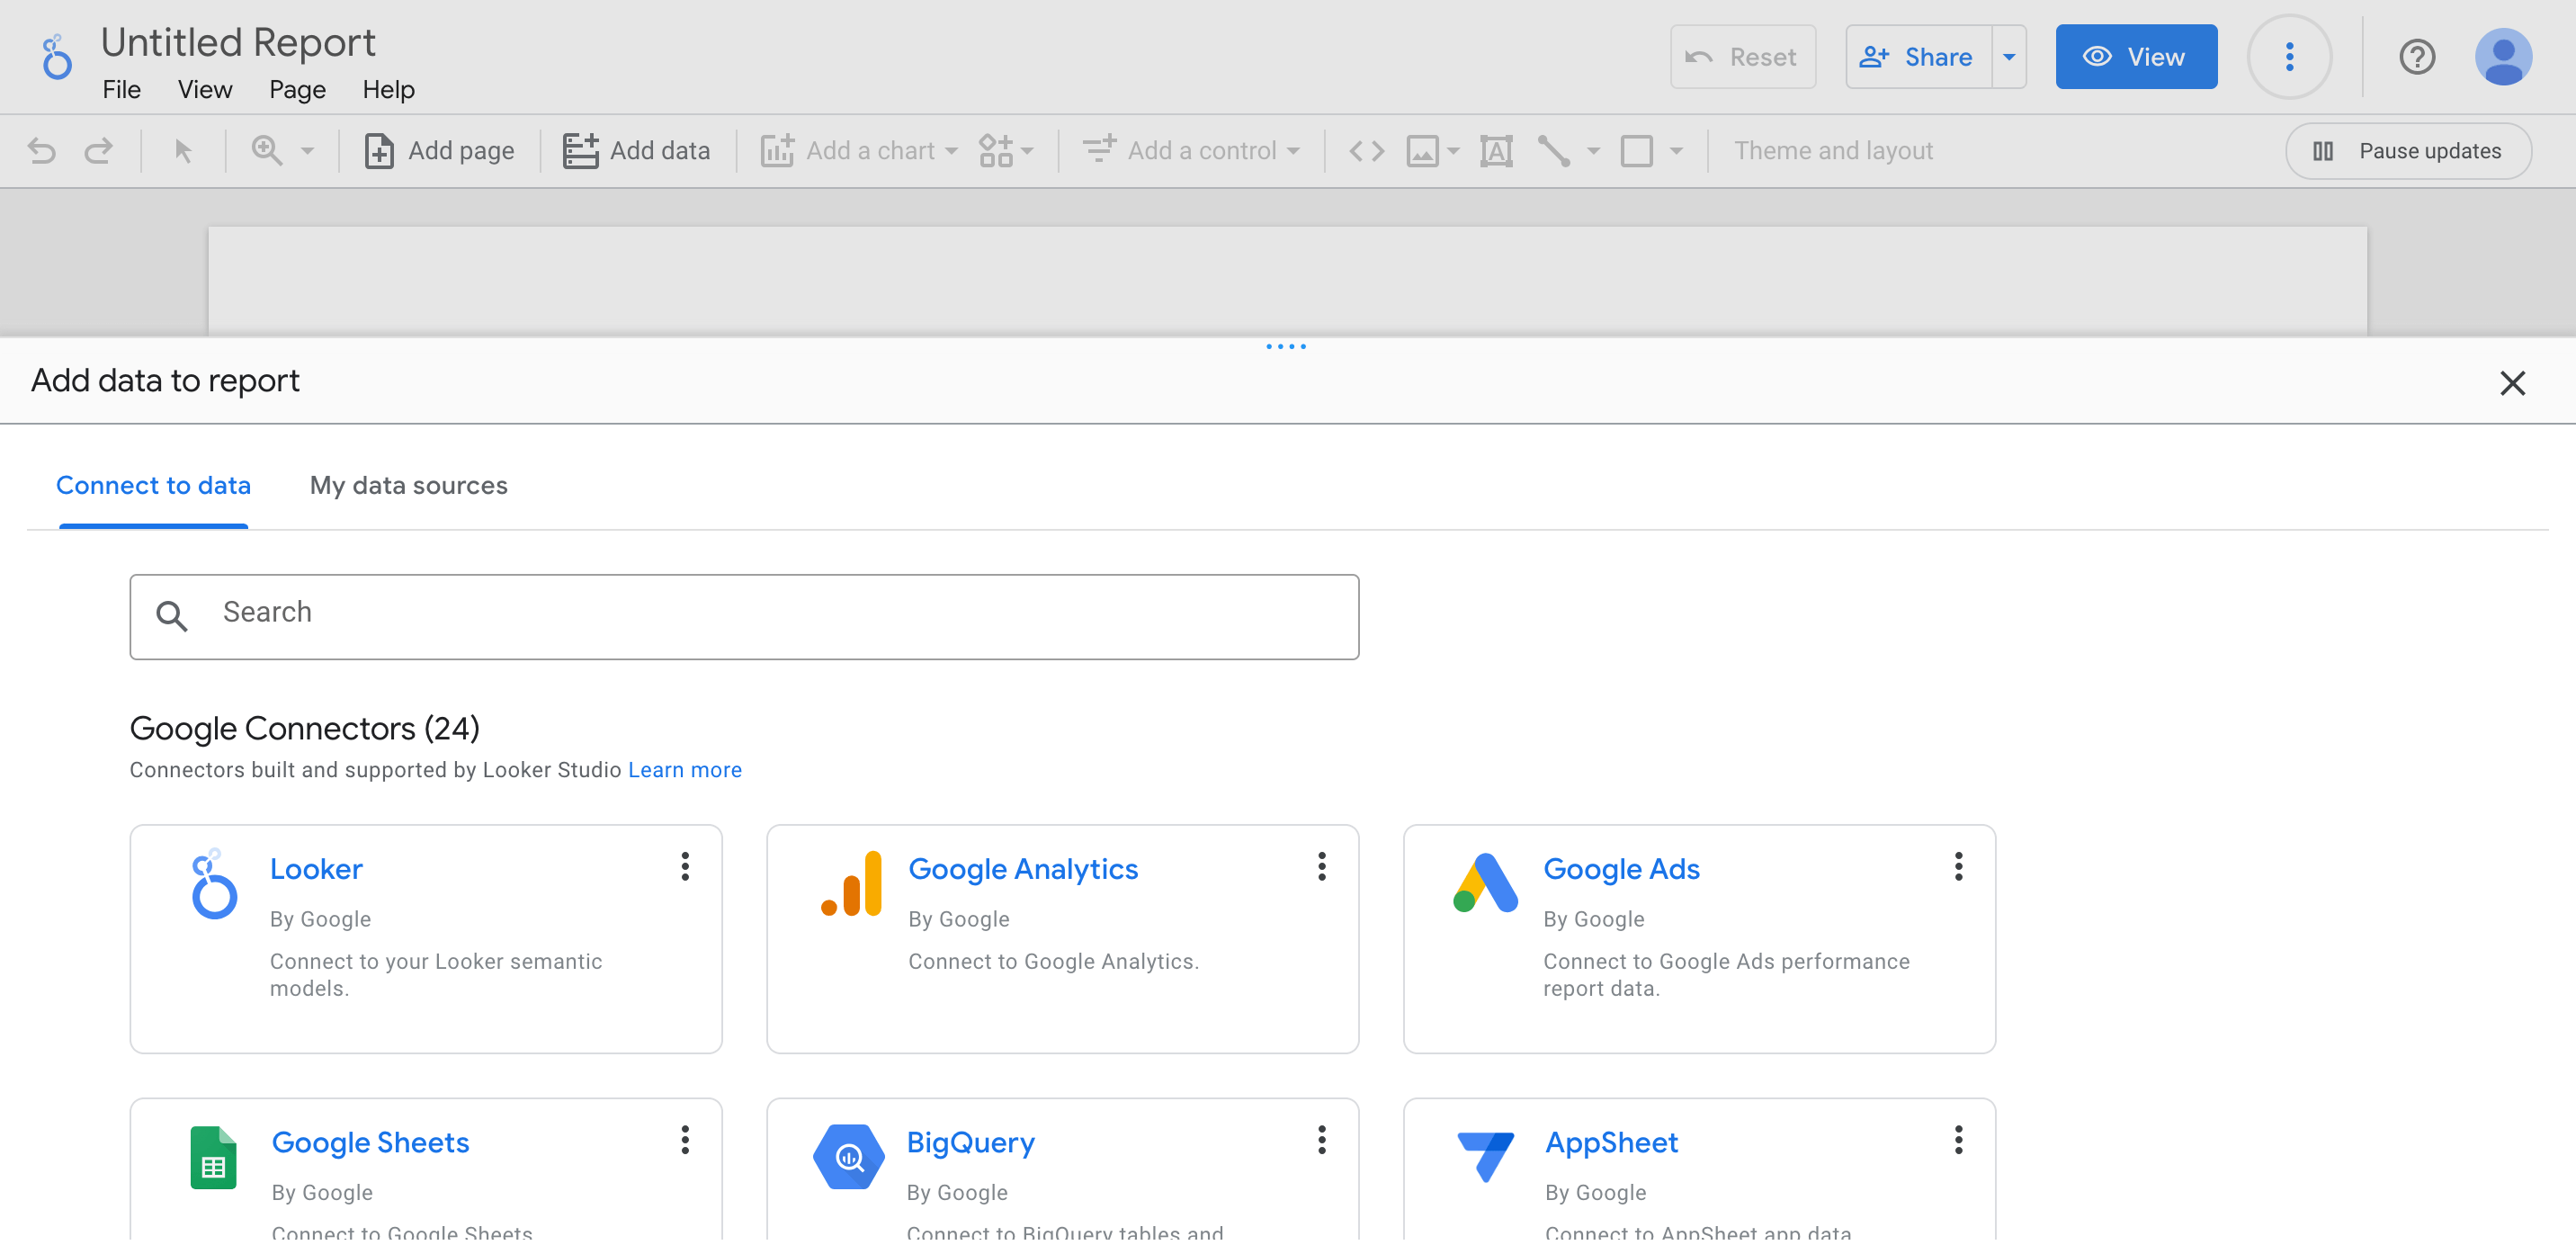
For this tutorial, we will be using Sample Google Analytics Data. Simply, click on the data source and you will be asked to add it to the report.
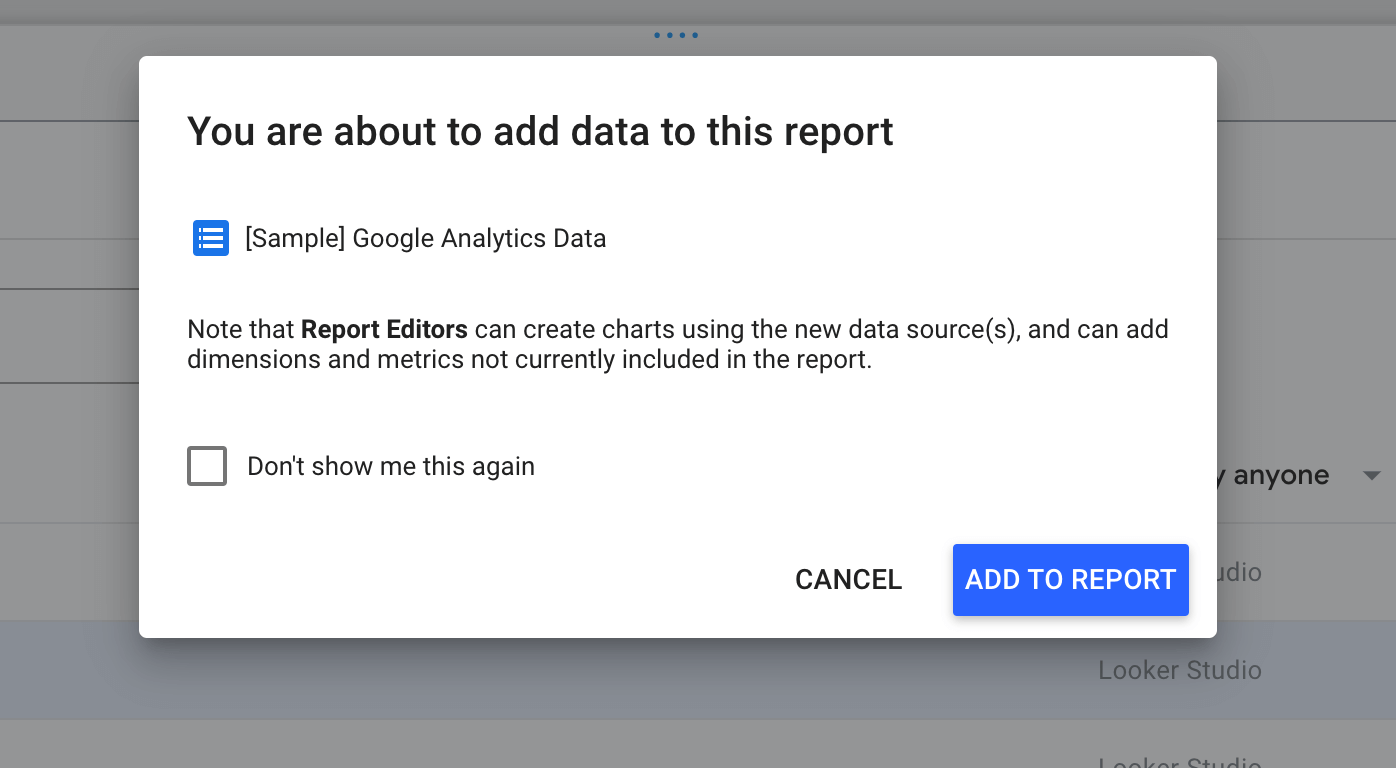
Add the data to report by click on the Add To Report button and your report will be integrated with your data source (Google Analytics for this tutorial). You can also customize which data fields that you want to connect in a spreadsheet view.
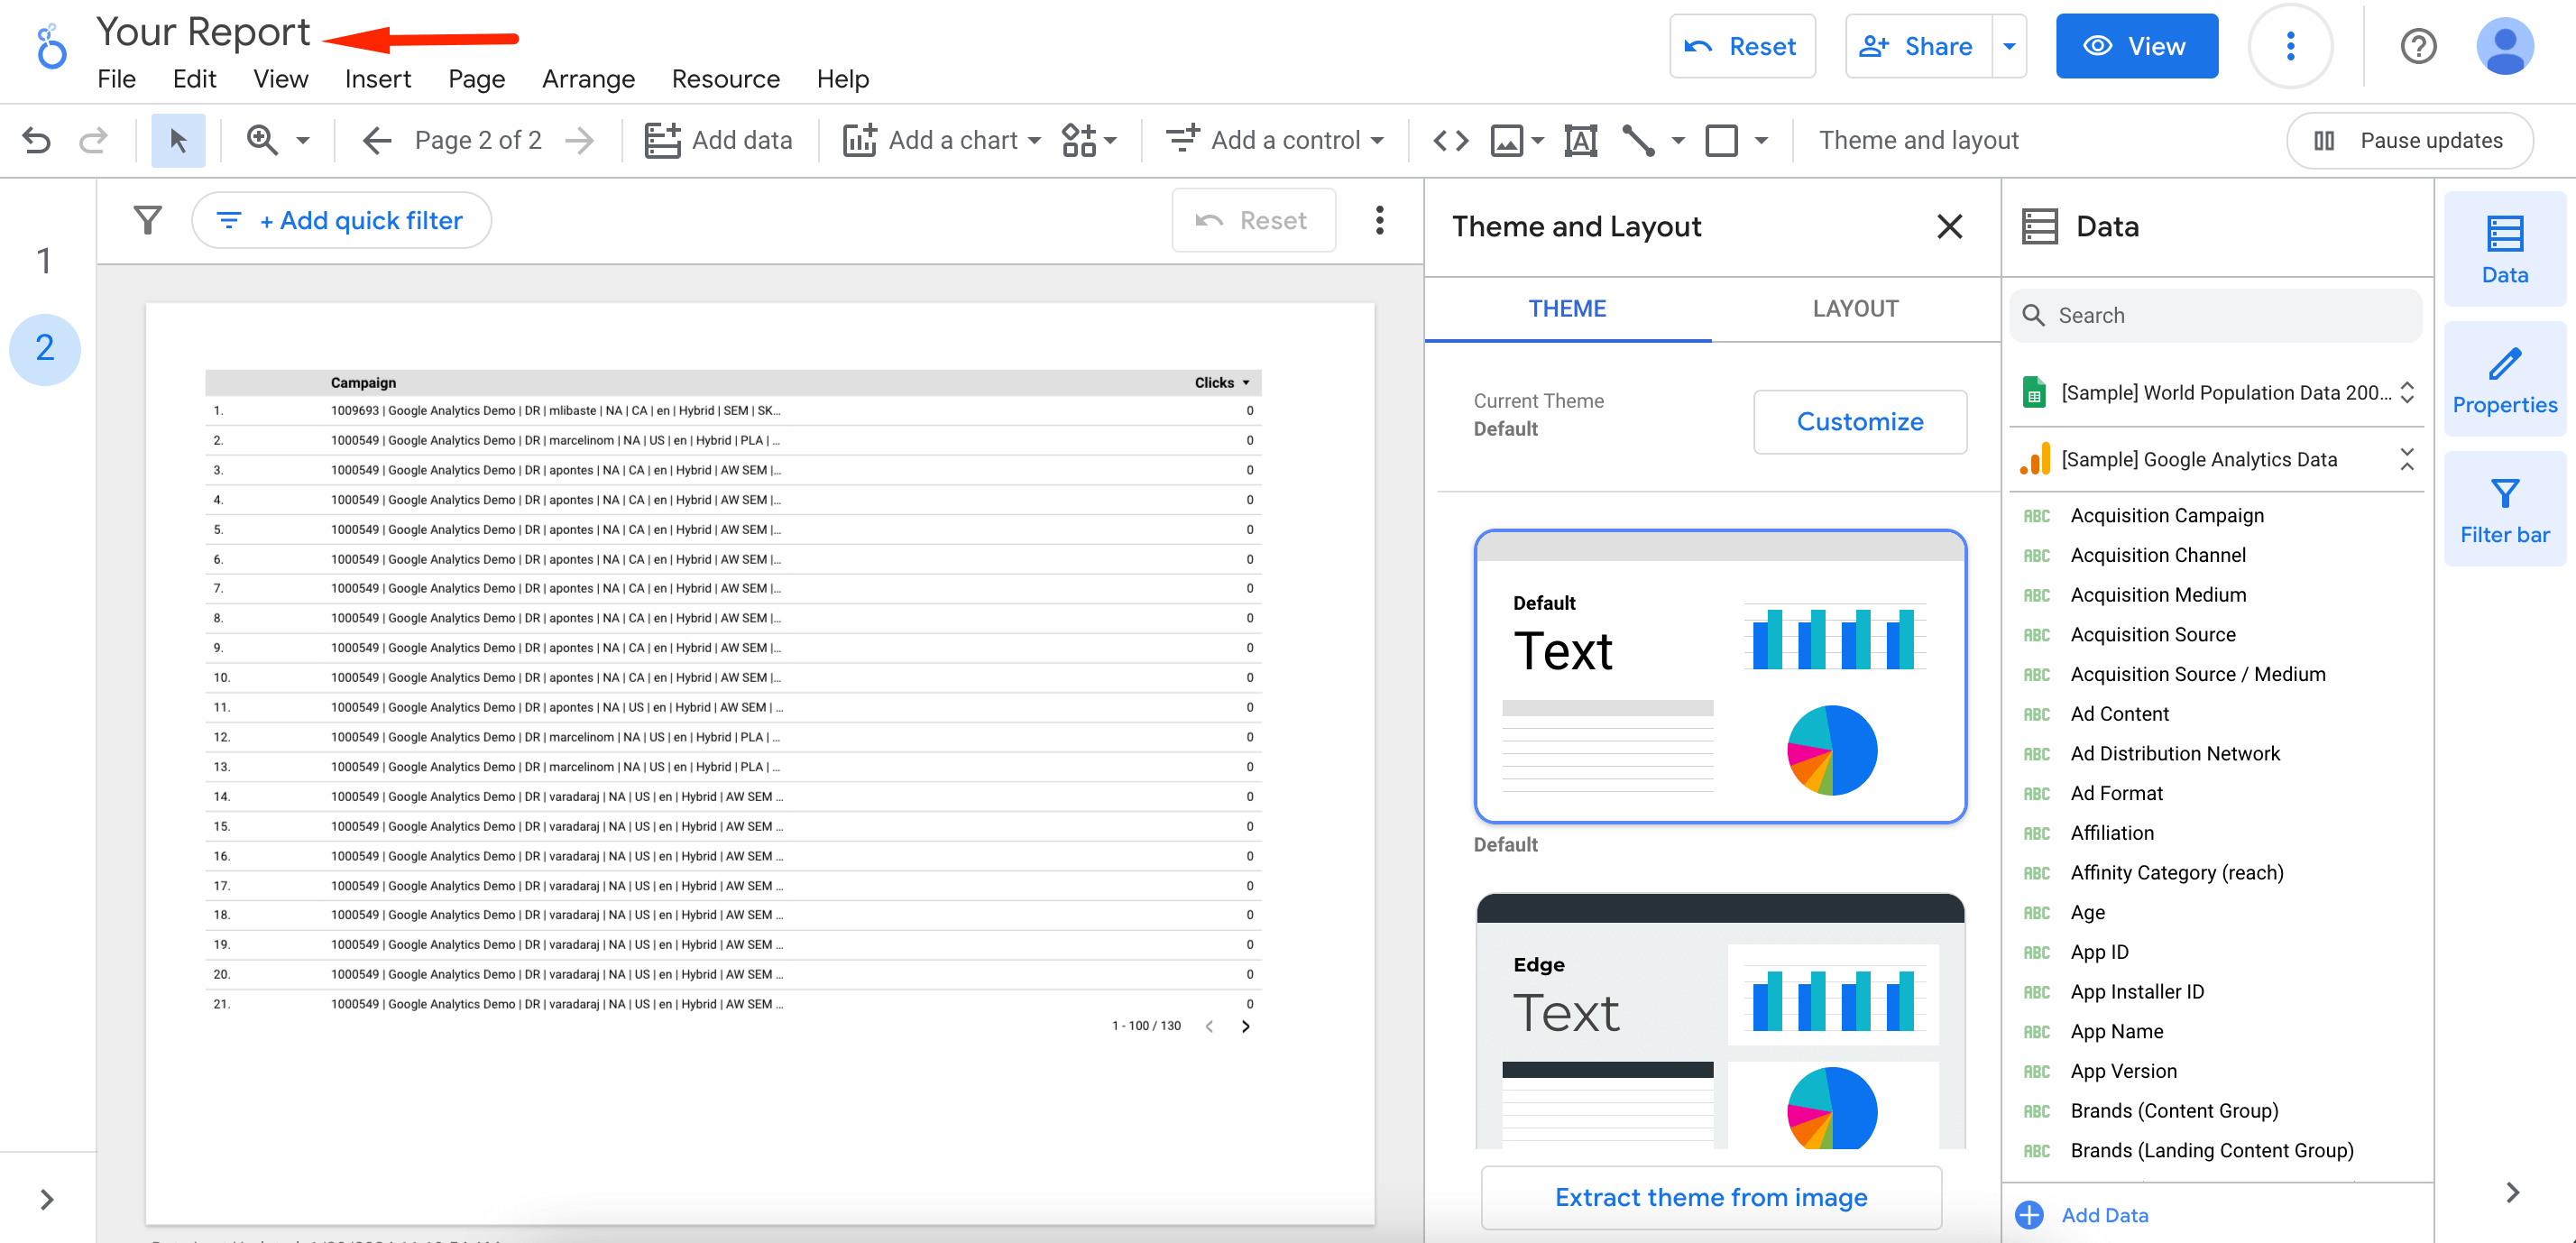
Step 4: Customize Your Report
After successfully adding data, you can customize your report. Click on the title to change it as the way you want. You can also change the layout and themes from the right menu bar. It's very easy to customize as there are fewer options.
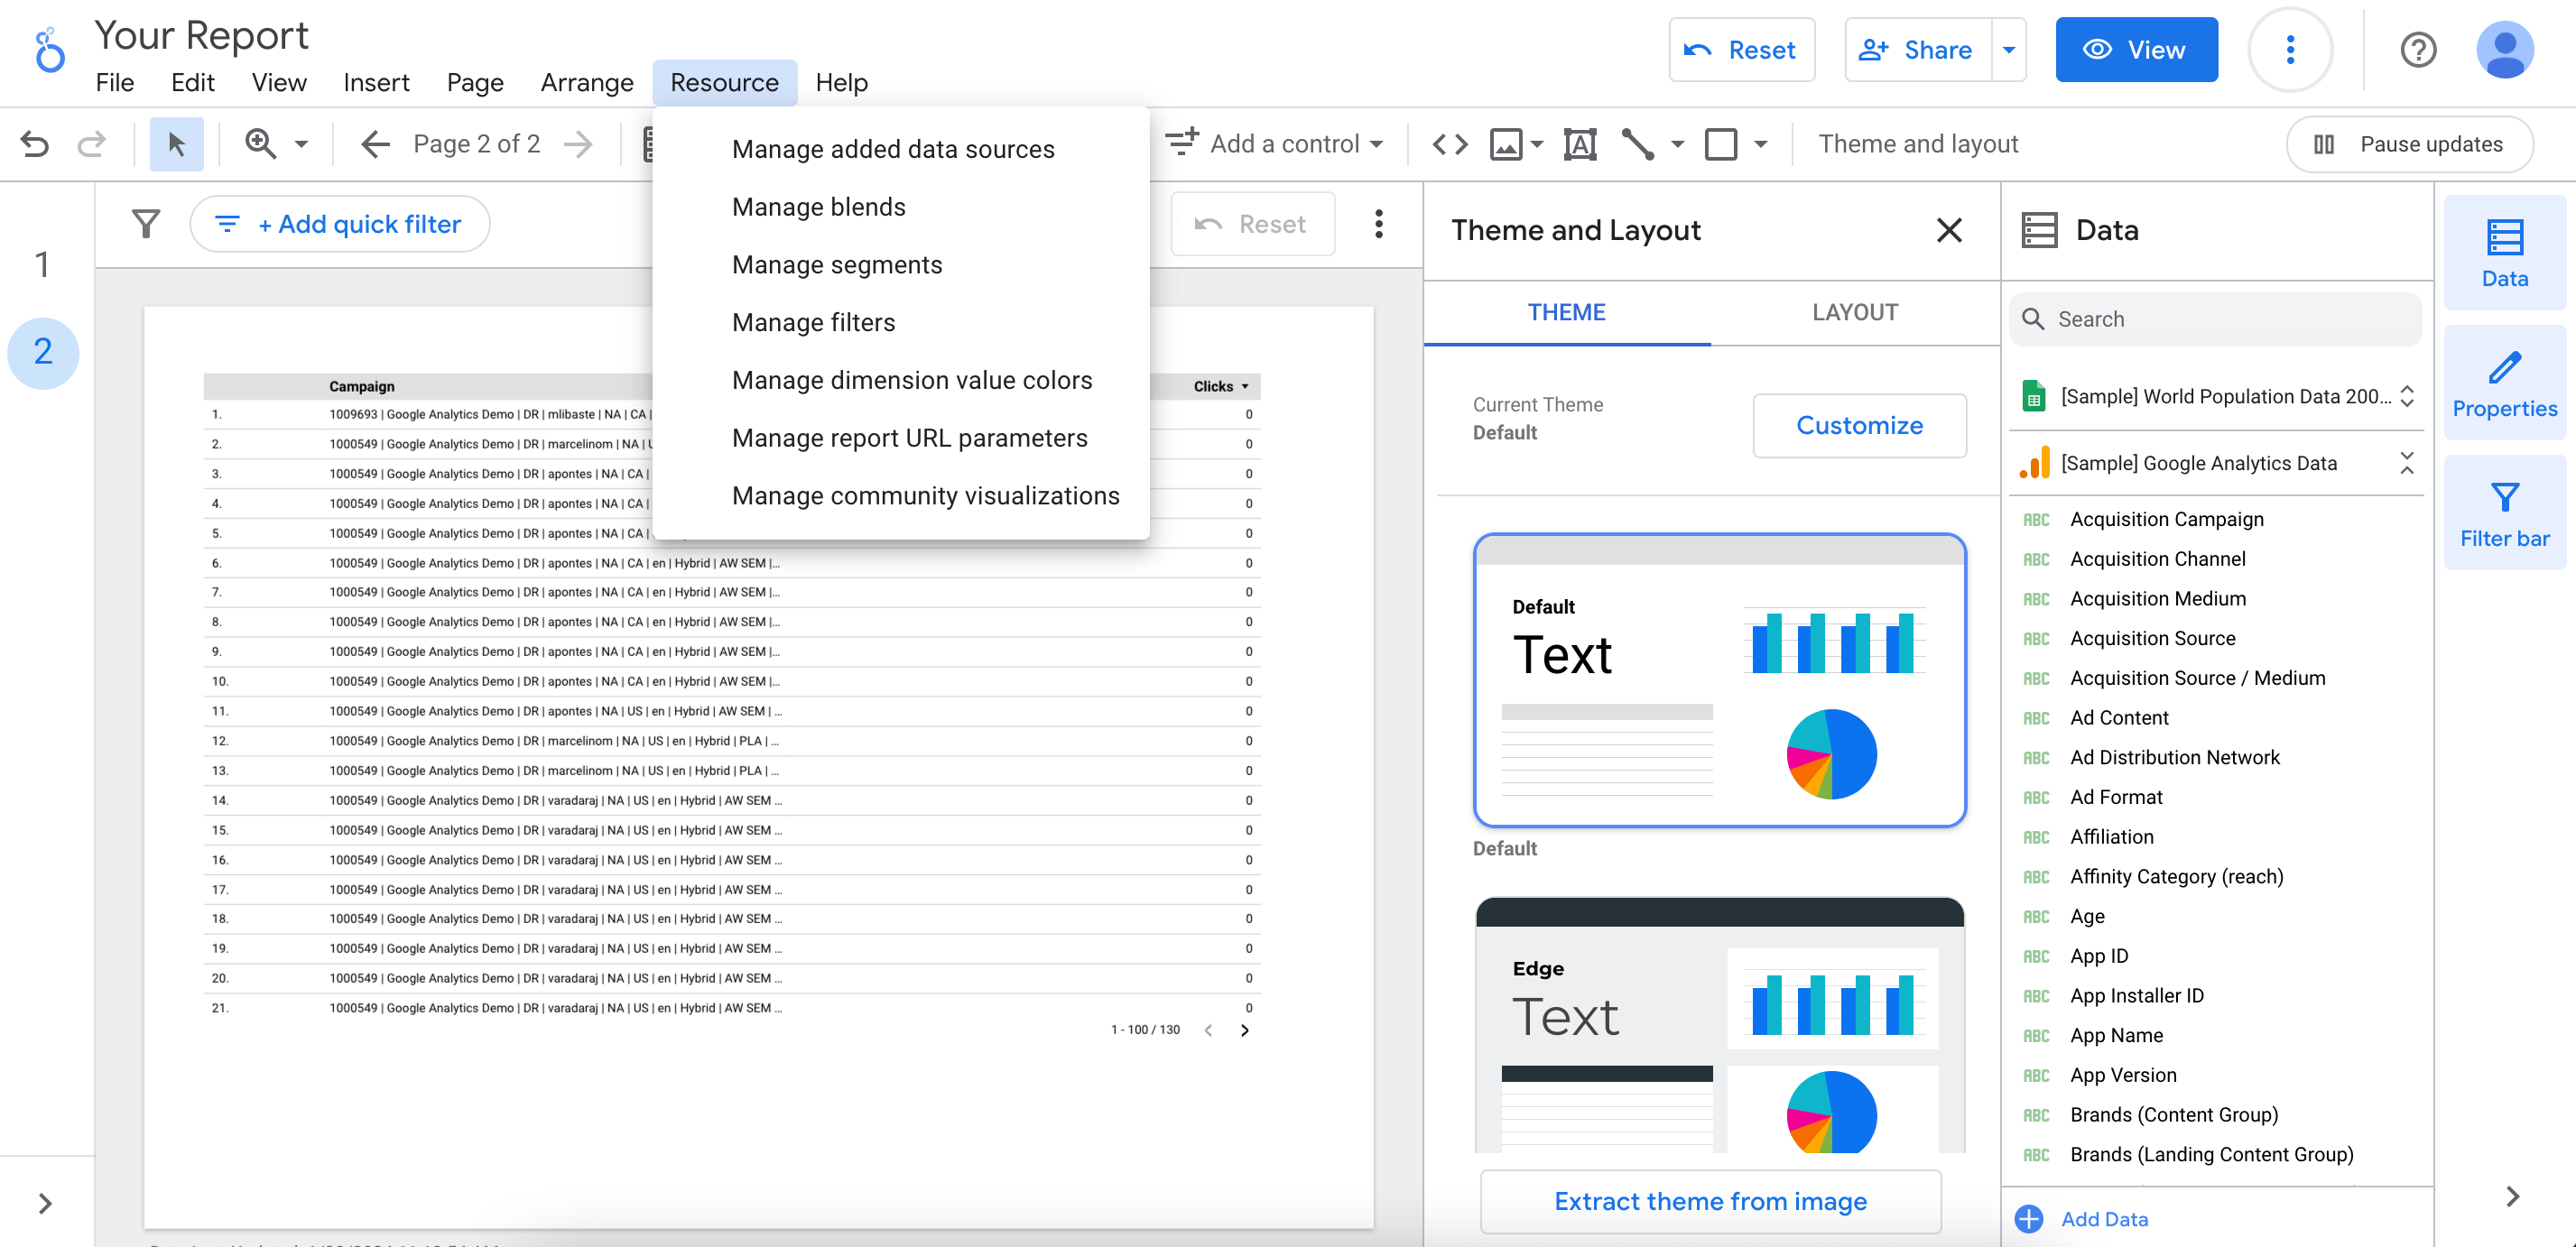
You can also add multiple data sources if you want. Click on the Resources menu and select manage added data sources.
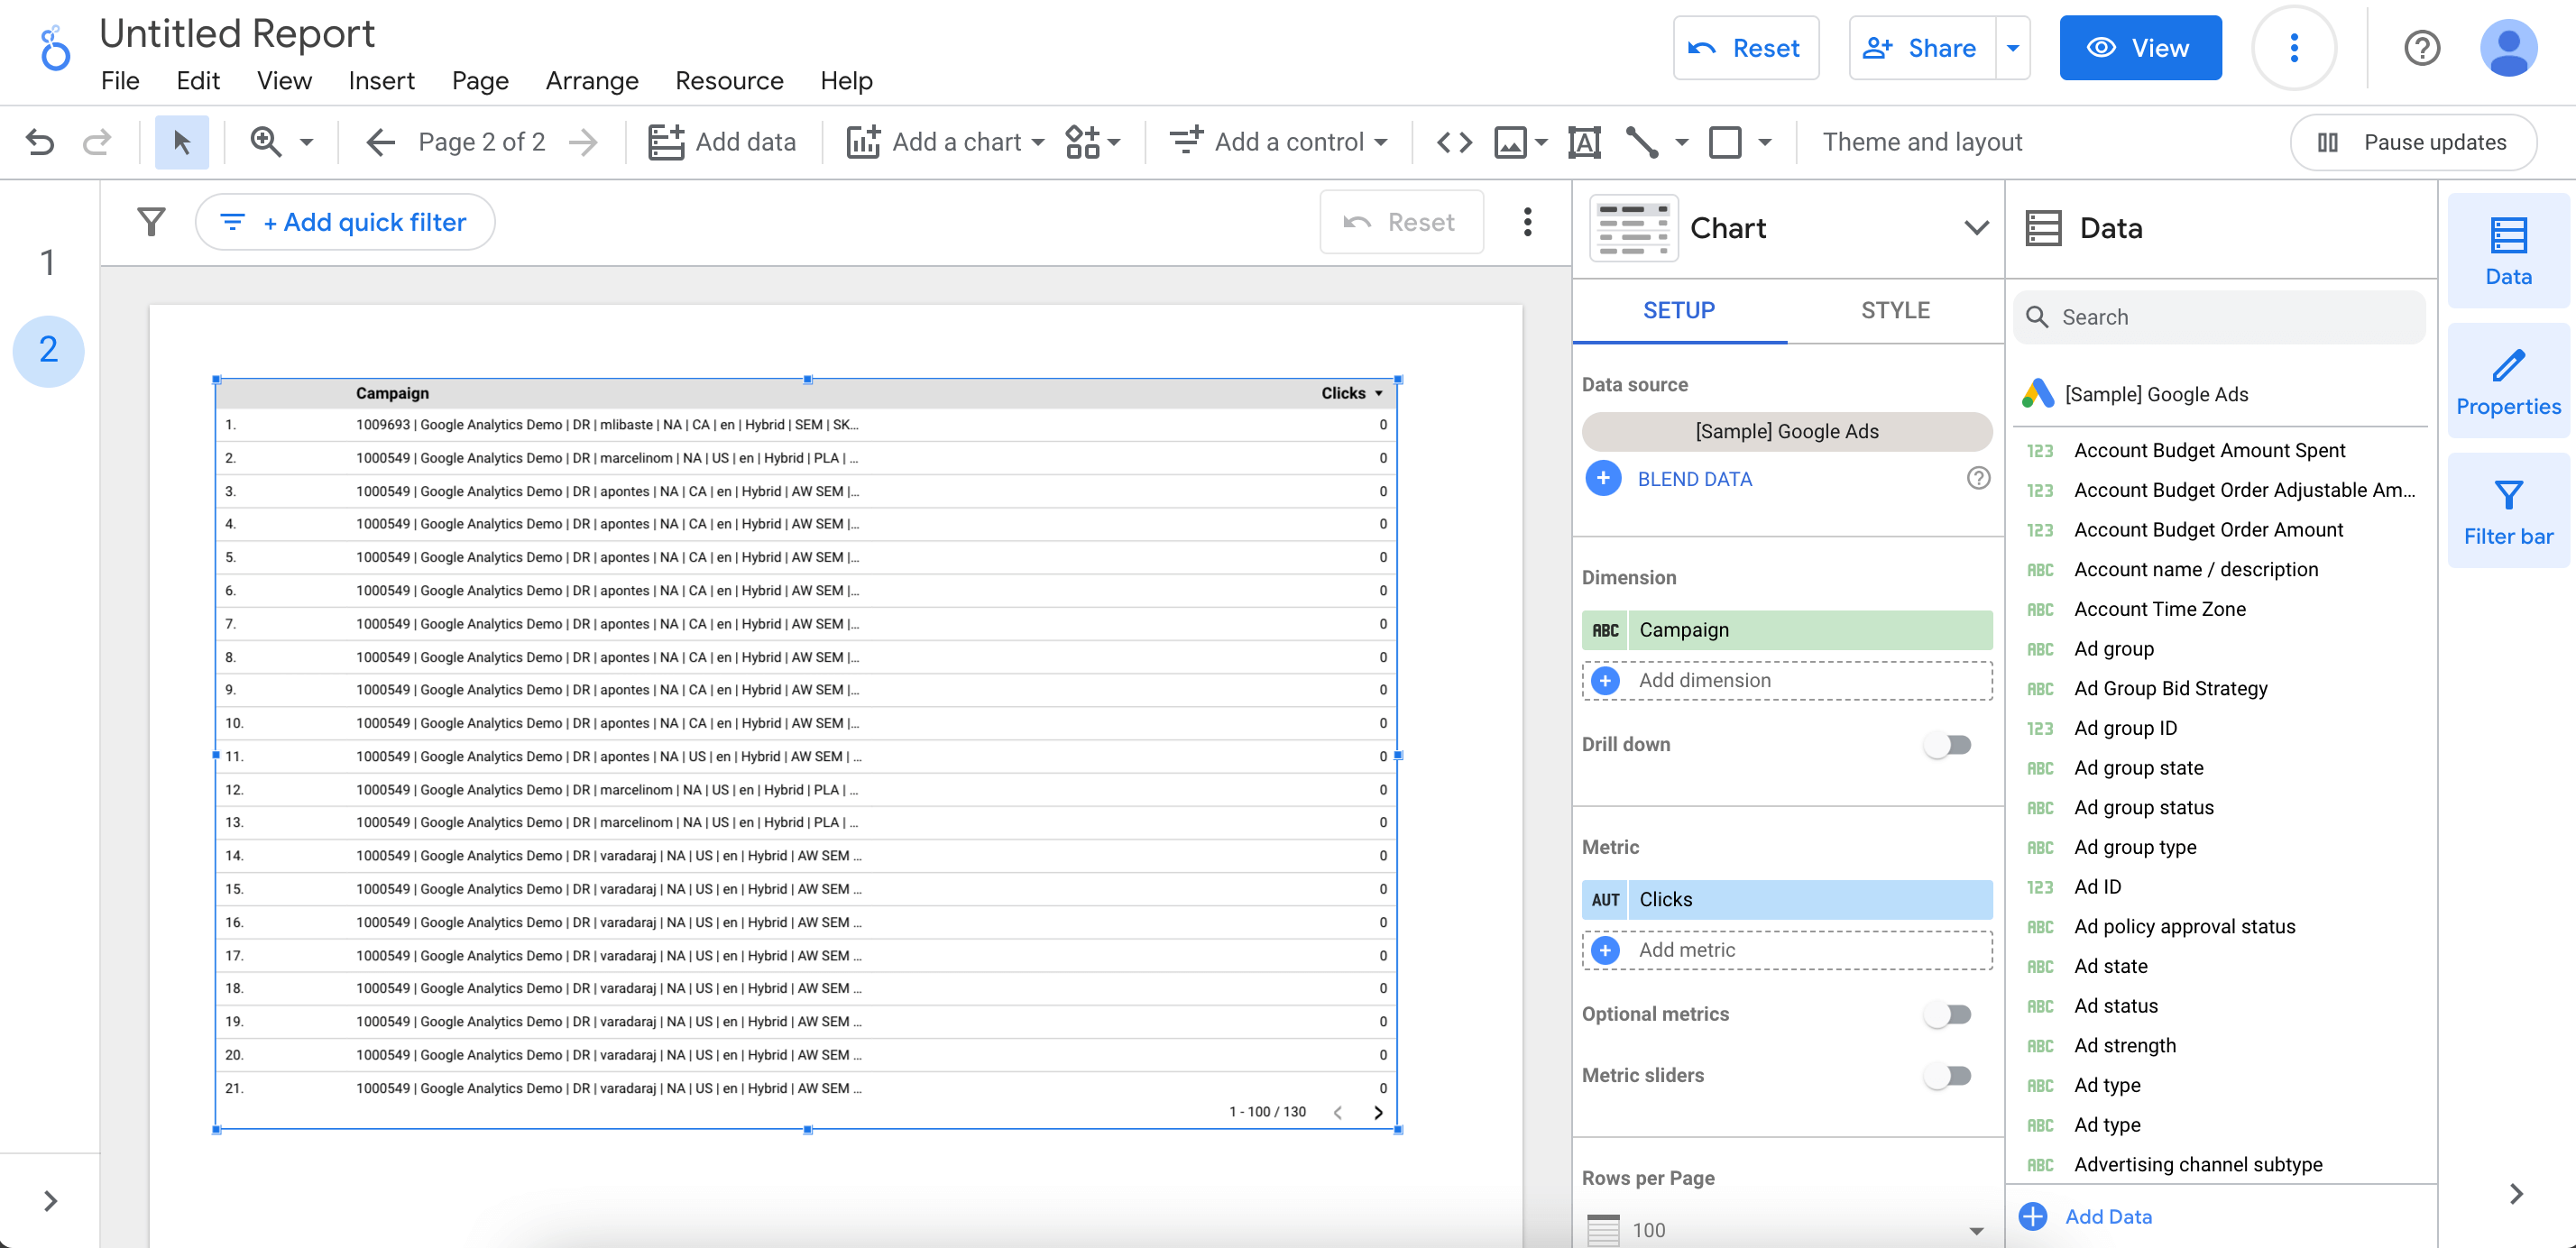
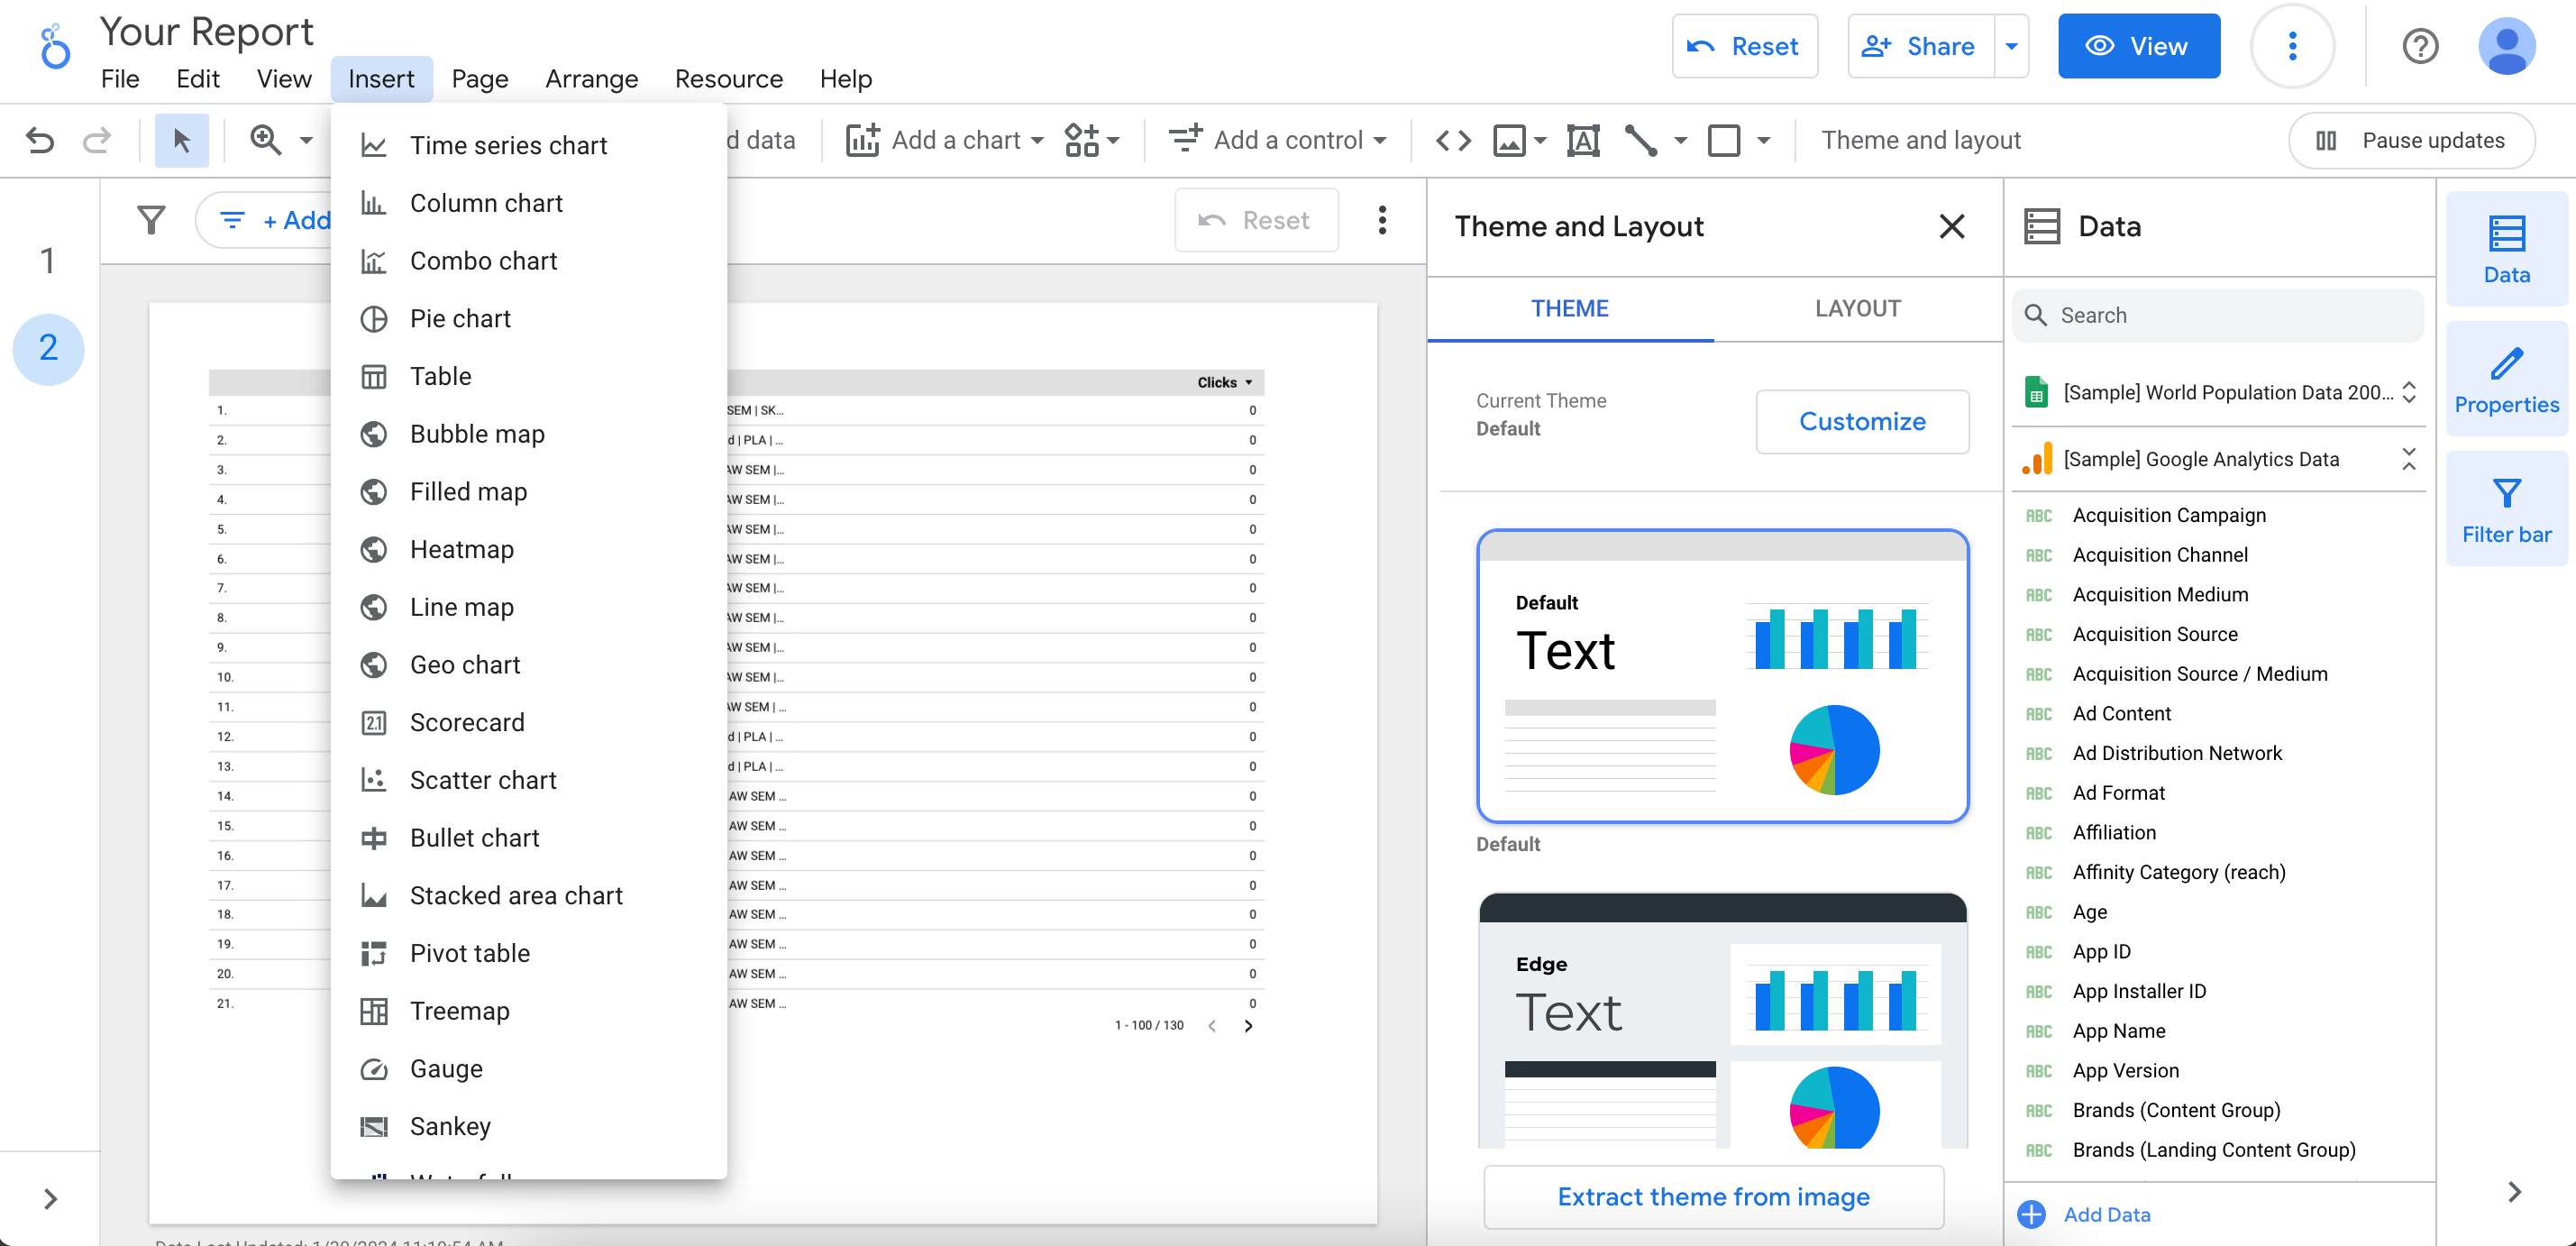
Step 5: Create Data Visualizations that You Can Understand
You can visualize your data in many different ways in Google Data Studio. There are options to create various charts, including time series, pie chart, combo chart, bar chart, table, scorecard, bullet chart, scatter chart, geo map, pivot table, and many more. You can also include images, shapes, and text where you need.
After selecting your visualization, simply put it on your report with an easy drag-and-drop feature. You can resize it, select a data source, add data from the available fields, and choose dimensions and metrics.
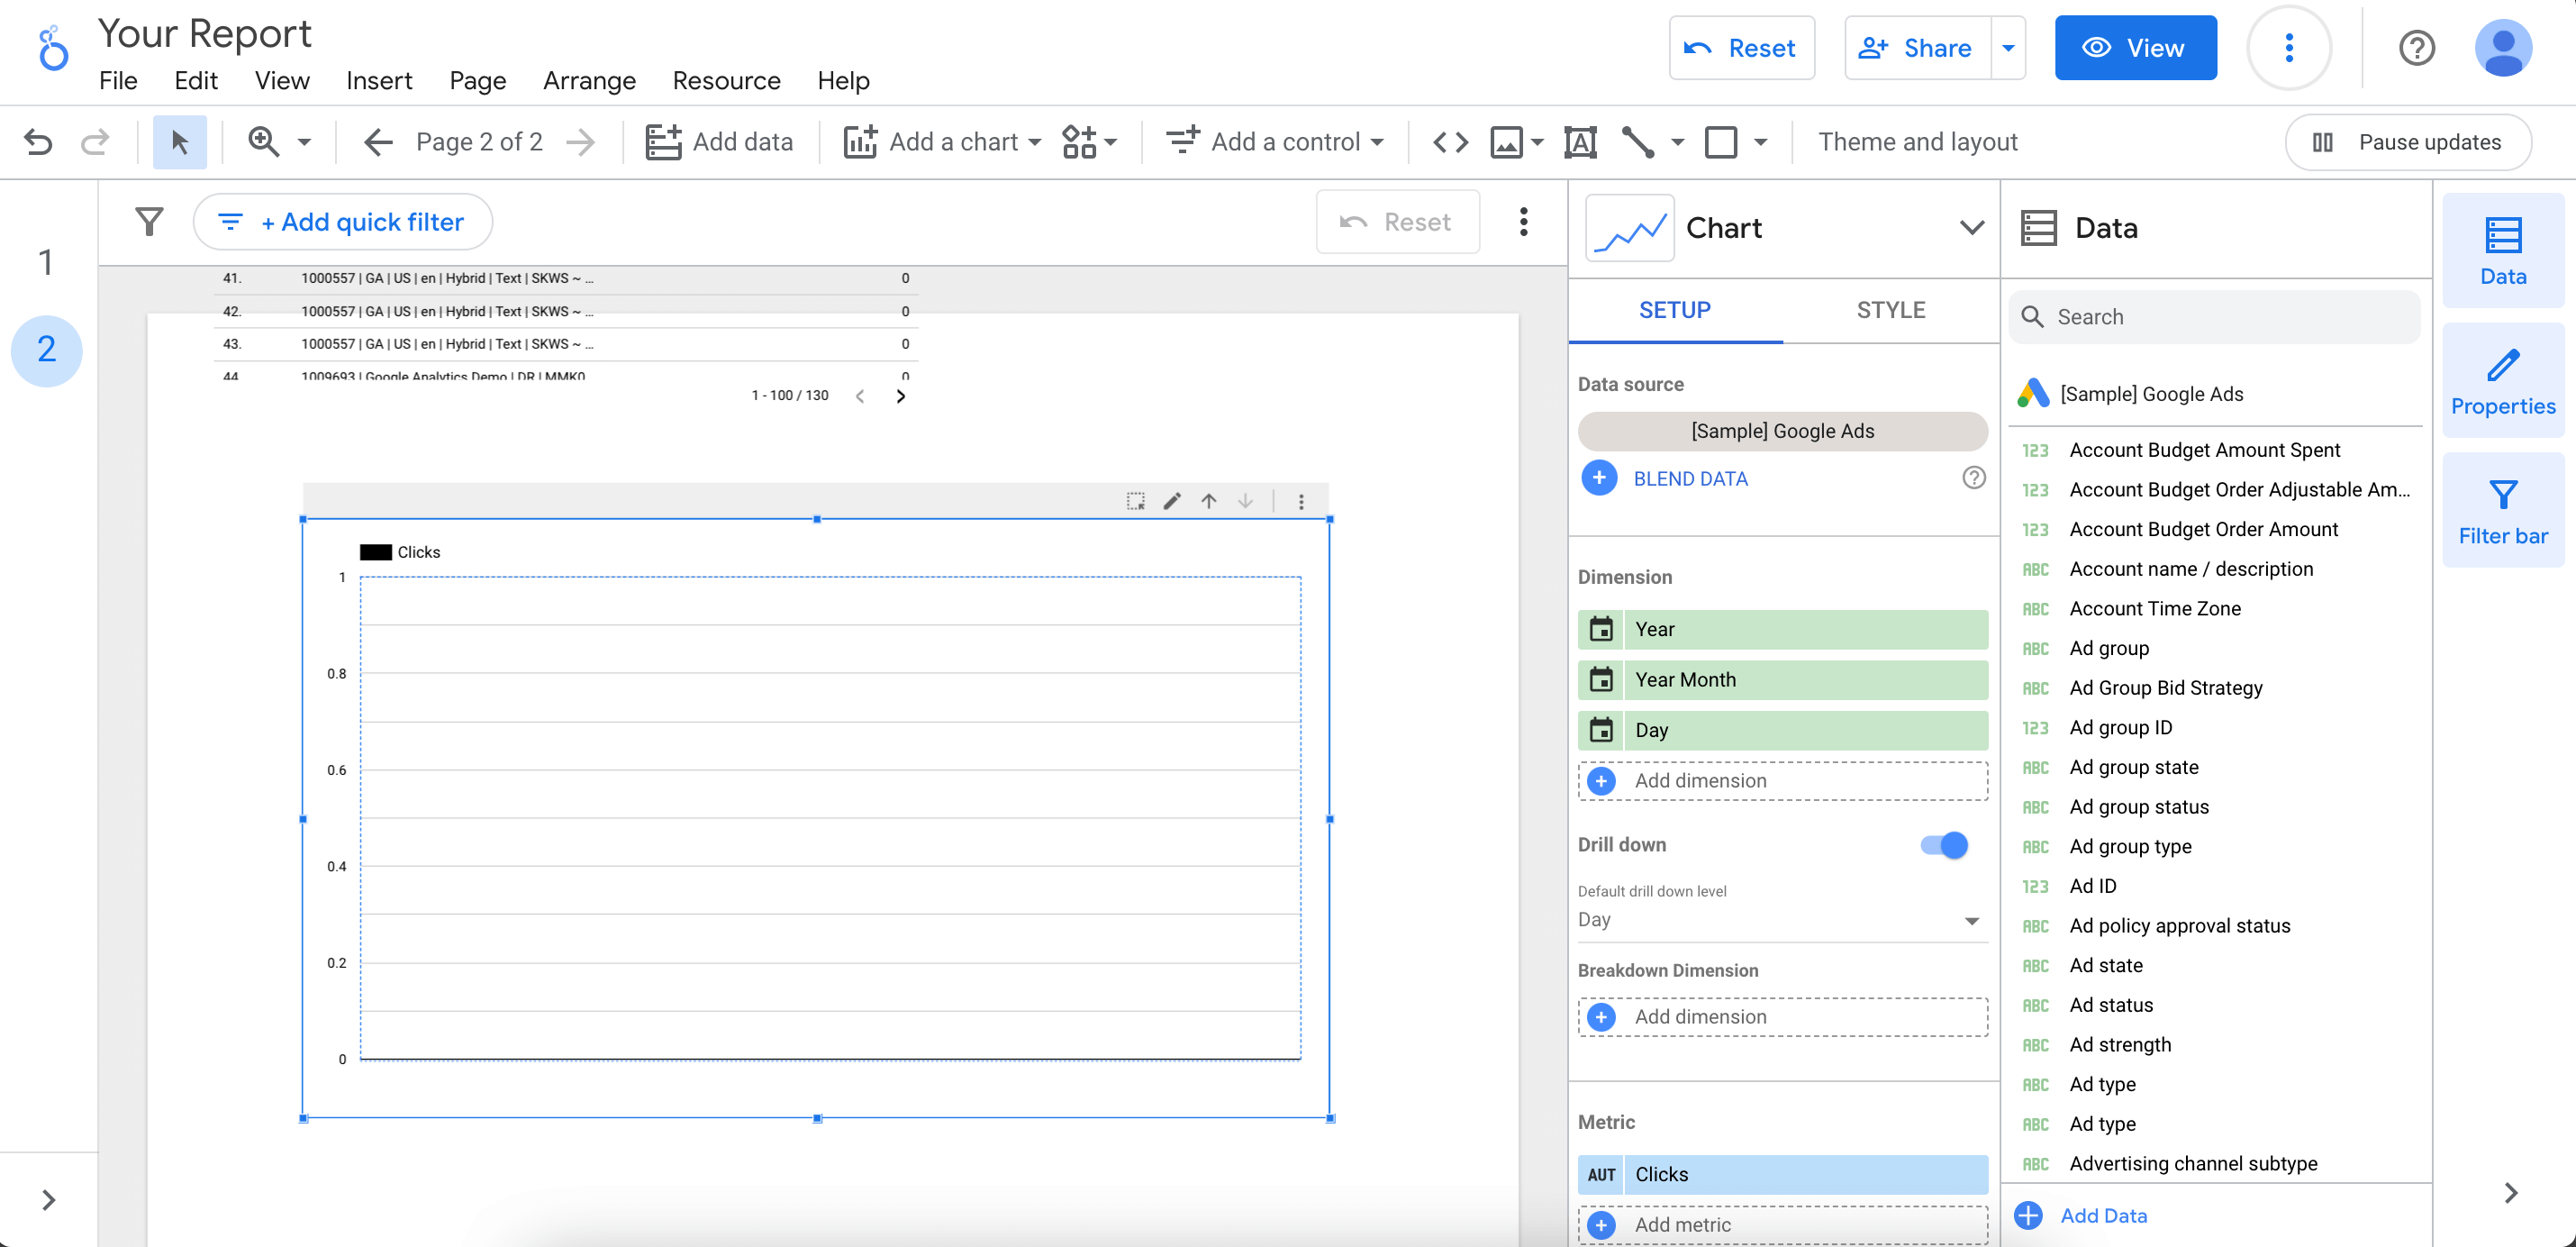
Apart from that you can filter and sort your data. Also, there are options to edit its style.
You can add as many charts as you want and also transform them into different ones.
Step 6: Easily Share Your Dashboard
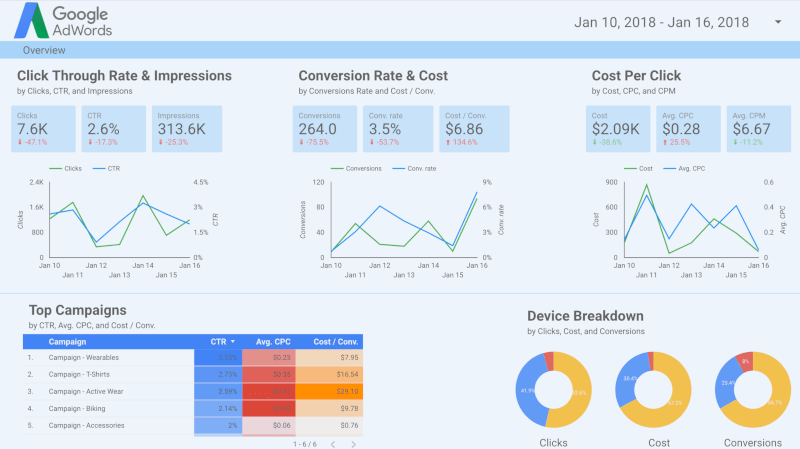
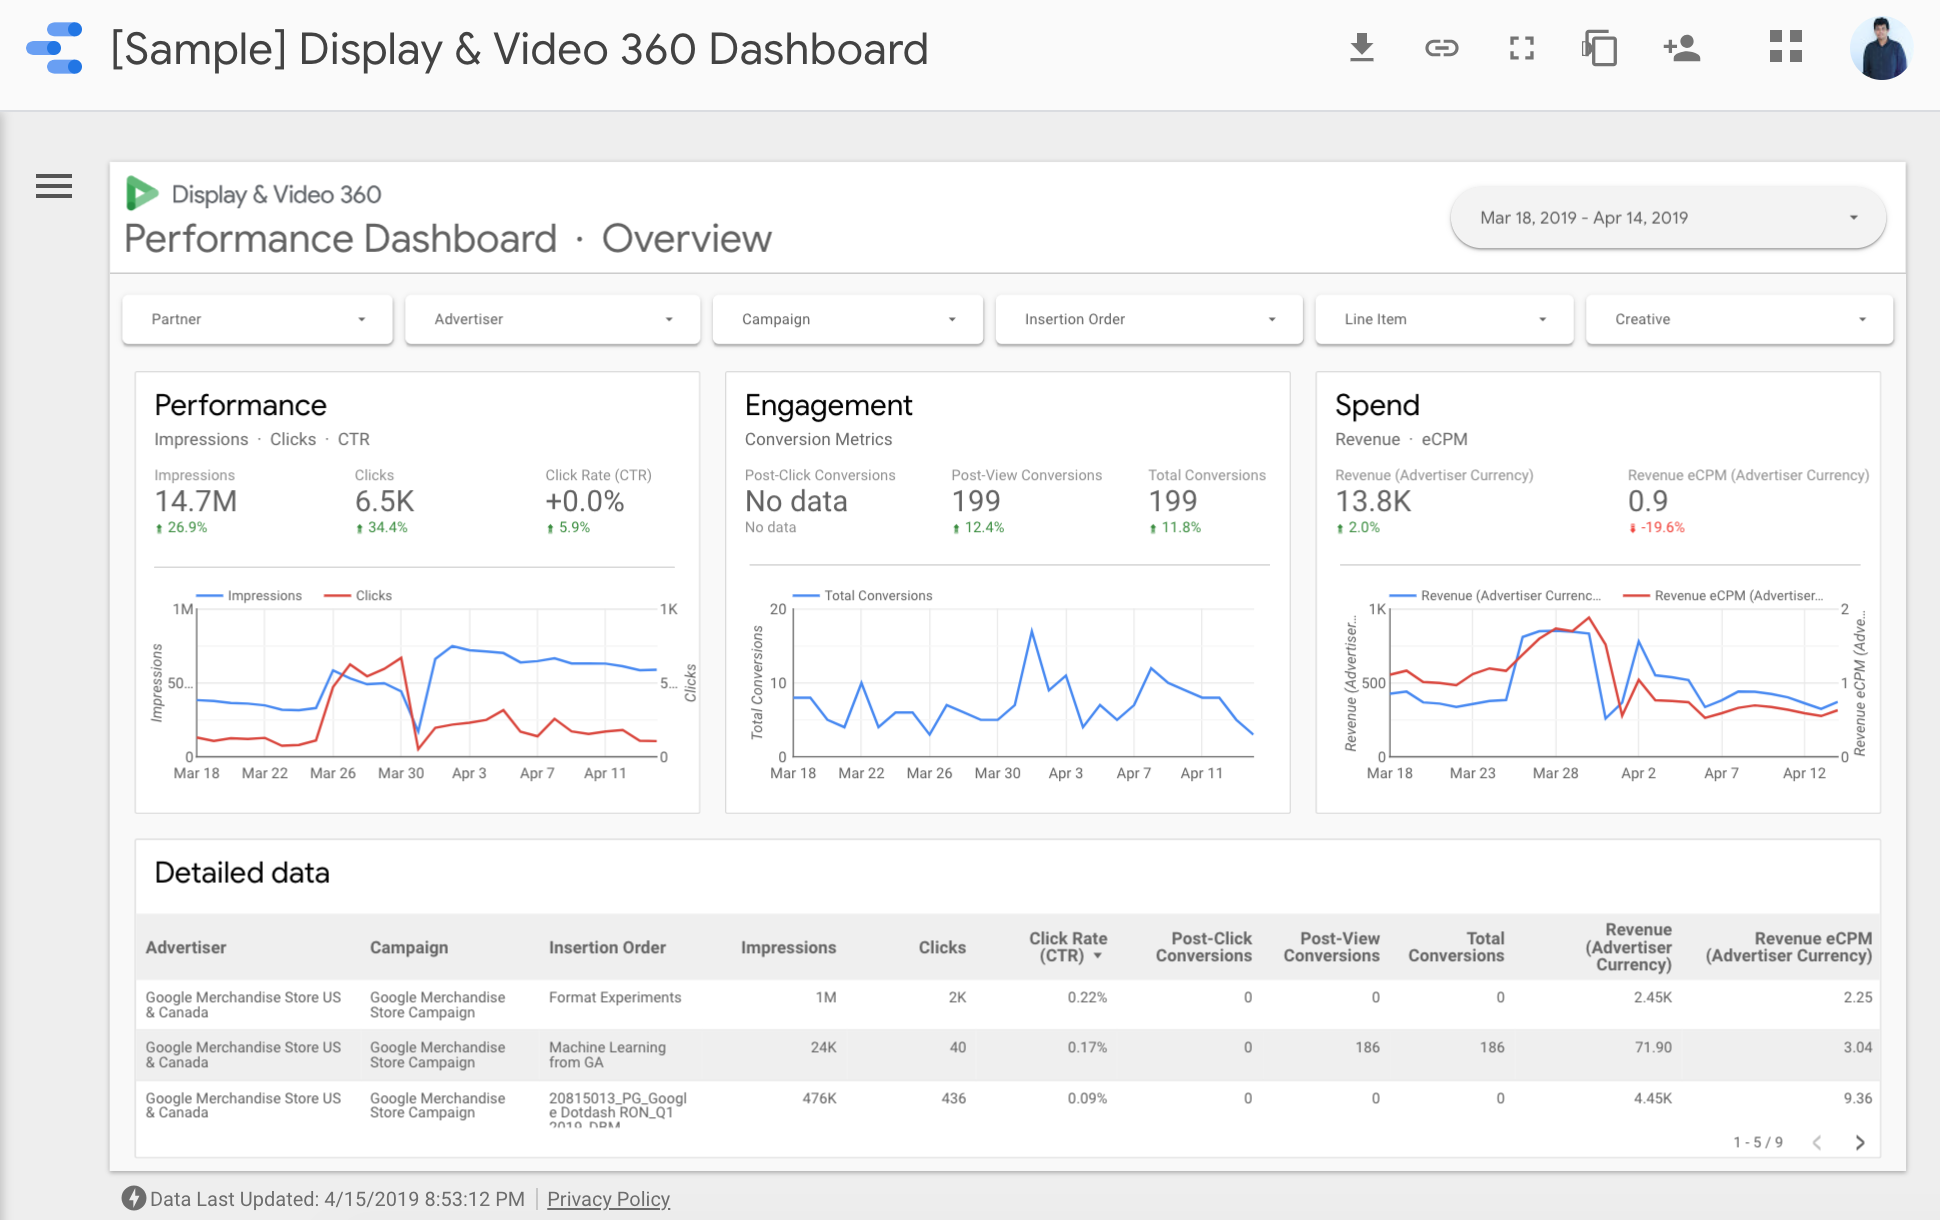
After adding charts and visualizations, you can create dashboards like this.
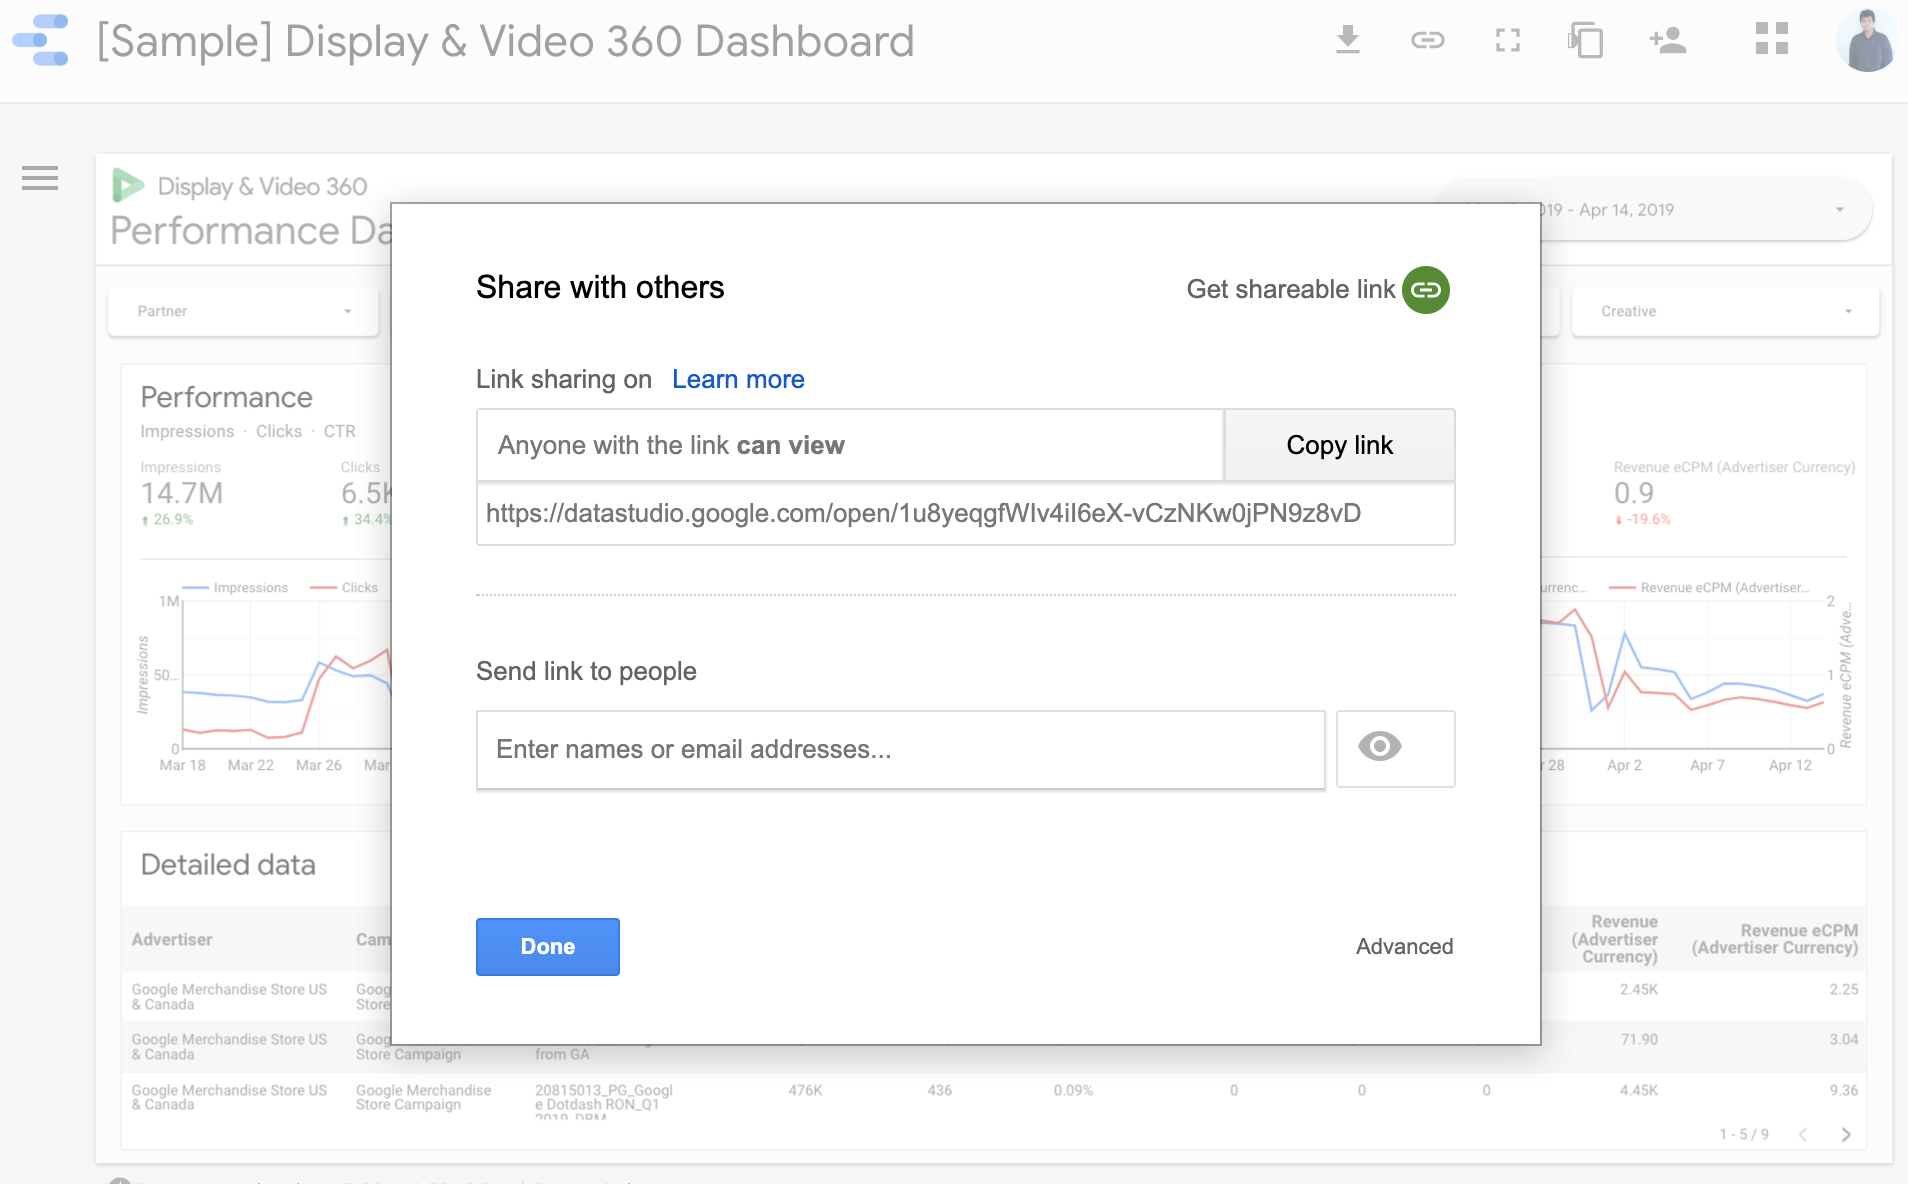
Finally, you can share it with others just like Google Docs.
Get a short overview on Google Data Studio prepared by Google Analytics.
Most Common FAQs on Google Data Studio (Google Looker Studio)
Looker Studio is free and covers most reporting needs. Looker Studio Pro adds team-level features such as improved collaboration, version control, enterprise support, and shared content management. Pro is designed for large teams that need stronger governance.
Yes, but only if your connector supports real-time data. Google Analytics 4’s real-time reports can feed into Looker Studio, and some third-party connectors offer live updates too. Other sources refresh on schedule, not instantly.
There’s no strict limit. You can add multiple connectors in a single report as long as you manage blend performance well. Too many high-volume sources may slow down your dashboard, so keep each page focused.
Blended data is accurate only when the join keys match properly. If your dimensions don’t line up, Looker Studio may show incomplete or mismatched values. Always check that the primary keys (like date, campaign ID, or page path) match across the sources you blend.
Wrapping up on Google Data Studio (Google Looker Studio) Marketing Dashboard
Google Data Studio gives you a fast, simple way to understand your marketing data. Once you know how to pull the right numbers, connect your sources, and build clear visual reports, you can spot what matters and act on it without digging through spreadsheets.
The best part is that you can keep improving your dashboards as your goals grow.
Take it step by step. Start with one report you need the most. Add the charts that answer your key questions. Share it with your team so everyone works with the same insights. As you get comfortable, create more dashboards that guide your decisions.
Data becomes useful only when you can read it, understand it, and act on it. Looker Studio helps you do exactly that, and now you’re ready to make the most out of it.
Learn how to set up GA4 to track your eCommerce website performance.