

How to Set up GA4 to Track Your Ecommerce Website Performance
Have you configured Google Analytics 4 to track your online store's performance? This guide introduces you to the latest version of analytics and how to utilize GA4 eCommerce for your business growth.
Google Analytics 4 also known as GA4 is the latest version of Google Analytics.
This is a powerful marketing tool that allows you to measure traffic and engagement across websites and mobile apps. Now you can measure different metrics of these platforms and compare them on one platform.
This is the reason, Google Analytics 4 properties are known as “App + Web properties.”
Moreover, GA4 eCommerce brings more advanced features and reporting systems to enhance user experience in online stores.
As you already know Universal Analytics stopped working permanently from 1st July 2023. Therefore, it requires quick steps to configure the new Google Analytics 4 property and start collecting data. [If you haven't done yet]
In this article, we will share some step-by-step instructions to set up Google Analytics 4 property and configure GA4 eCommerce.
Let's dive in 👇
Evolution of Google Analytics & How GA4 Comes into The Play
Google Analytics was first launched as a website measurement tool. This tool aimed to provide website owners and marketers with valuable insights and data about their website's performance.
For example, a user comes to your site by clicking on a particular ad. Google Analytics tracks that data and shows you the source in the report.
You can use that data to improve customer experience and earn better ROI from your paid marketing.
In this way, you can check other sources of your website visitors and their activities after landing on your website.
Google Analytics helps you to-
- Understand the volume and sources of traffic
- Analyze how users interact with your website
- Set up and track conversions and specific goals
- Measure Campaign Performance
- Monitors your website's technical performance
- Take care of page load times, site speed, and mobile responsiveness
- Gain demographic and interest data about your website visitors.
By analyzing data in Google Analytics, you can measure the effectiveness of your marketing efforts and identify opportunities to improve ROI. It helps you make data-driven decisions, optimize campaigns, and allocate resources more efficiently.
Are you running a WordPress website? Check how to add Google Analytics to your WordPress site.
The Emergence of Google App Plus Web

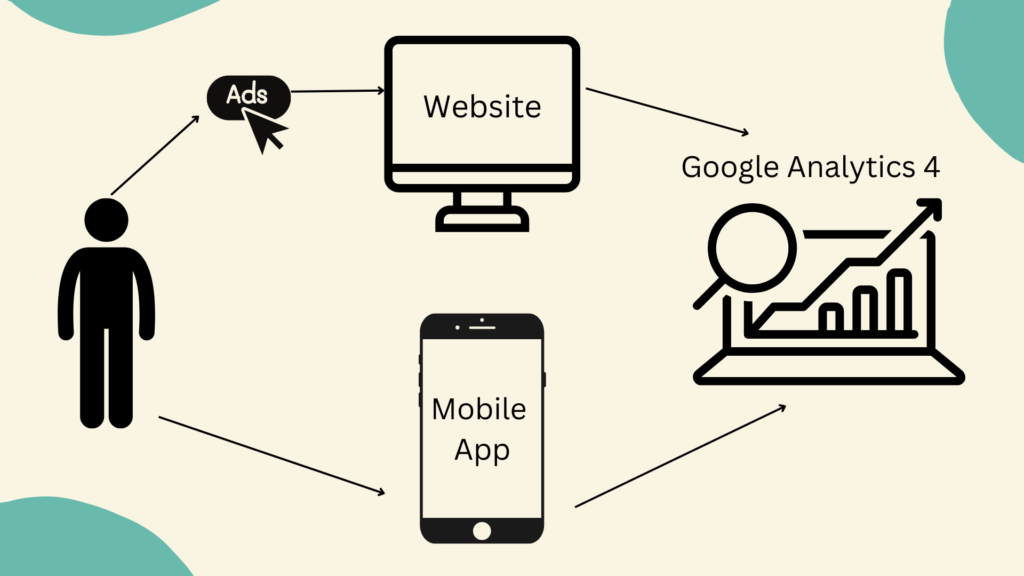
After that, when the use of mobile apps started increasing, Google Analytics launched another version called App Plus Web. It allows businesses to measure app and website usage.
As you know, digital buyers now use multiple devices to make their purchase decisions. Therefore, it becomes crucial for businesses to understand the cross-device journey of the users.
For example, a user might see an ad on the web and visit your website. But leaves the website without making any purchases. Then goes home and purchases on the app.
Now, without connecting the app and web data, you can't realize the actual picture. It may seem like the ad won't work and the user did not buy it. Because according to the website data usage, the user came from the ad but didn't complete the purchase.
Check 15+ strategies to increase your eCommerce sales.
On the other hand, App data would show a conversion. But it could not identify the real source of that user. Because it does not know it's the same user who clicked on the ad and went to the website first and then bought on the app.
So, there creates a gap.
Due to these issues, website owners and marketers couldn't see the complete user journey.
To track the activities on multiple devices, it became essential to connect all the data points.
And that's where new Google Analytics comes into play.
What is Google Analytics 4 and How It Works for Your eCommerce Store?
Google Analytics 4 (GA4) shows you the complete user journey across devices.
It diminishes the issue of tracking users' journeys coming from different devices.
Now you can connect all the data points and track the source of your users. No matter if they come and purchase from different sources like the web, apps, or even offline.
GA4 allows you to get all the data under one property. By analyzing this cross-device journey, you can better understand how your marketing efforts are working and where it needs improvement. It would be helpful to create a better customer experience across devices.
Relate resource: 4 Ways To Turn First Time E-commerce Customers Into Repeat Customers.
What Makes Google Analytics 4 Different from Universal Analytics?
GA4 differs from UA in several key ways.
One of the most significant differences is the new data model in GA4. Instead of using sessions and pageviews to track user behavior, GA4 uses events and properties.
As a result, GA4 can track more types of user interactions, such as video views, button clicks, and file downloads. GA4 also provides more flexibility in how you can organize and analyze your data.
Another important difference between GA4 and UA is the use of machine learning. GA4 uses machine learning to analyze customer behavior and identify trends and patterns. In turn, it provides more accurate and useful insights into user behavior.
For example, GA4 can automatically identify and group users based on their behavior, such as frequent purchasers or first-time visitors. This can help you better understand your audience and tailor your marketing efforts to their needs.
Cross-device tracking is another area where GA4 improves upon UA. With GA4, you can track user behavior across different devices and channels, including mobile apps and web browsers.
Hence, you can get a complete picture of how users interact with your brand, regardless of the device or channel they use.
The New Data Model in Google Analytics 4
The New Data Model in Google Analytics 4 (GA4) is a significant update that introduces a more advanced and flexible approach to data collection and reporting.
There are two main components of the Google Analytics 4 data model- Users and Events.
All the reports and the data collection inside GA4 evolve around these two components.
Users are people who interact with your website or app. However, there could be some bots interacting with your website or app as well.
But today we’re considering all real people who are coming and using your website or app.
Note: If you are a previous user of Google Analytics, you've already realized that there is no page view anymore. As mentioned earlier, GA4 uses events and parameters to track user behavior instead of sessions and pageviews.
Events are user interactions with your website or app, such as clicks, page views, download eBooks, form submissions, etc. Parameters provide additional information about the event, such as the category, label, and value.
Here are Some Key Aspects of The New Data Model in GA4
- Event-Based Tracking: GA4 utilizes an event-based tracking model, which focuses on capturing user interactions or events on your website or app. Events include page views, button clicks, form submissions, video plays, and more. This provides a more accurate and detailed understanding of user behavior.
- Enhanced Measurement: GA4's Enhanced Measurement feature automatically tracks common events, such as scroll depth, outbound link clicks, site search, and file downloads. So, you need not manually implement the tracking codes for these events.
- Flexible Data Schema: The new data schema in GA4 gives you more flexibility in organizing and structuring data. It uses a property-centric approach, where events and user properties are collected under a single property. This simplifies data management and analysis.
- User-Centric Analysis: GA4 supports a user-centric data model. It focuses on grouping user interactions across devices and platforms to provide an ultimate view of user behavior. This helps you understand the complete user journey and their engagement across various touchpoints.
- BigQuery Integration: GA4 offers seamless integration with Google BigQuery, a powerful data warehouse solution. This allows you to export your GA4 data to BigQuery for advanced analysis, custom reporting, and combining it with other data sources.
- AI-Driven Insights: GA4 leverages Google's machine-learning capabilities to provide AI-driven insights. It offers automatic insights, predictive metrics, and cross-channel attribution modeling to help you understand user behavior, identify trends, and optimize your marketing efforts.
- Data Controls and Privacy: GA4 introduces enhanced data controls and privacy features to align with evolving data privacy regulations. You can manage data retention, enable user consent modes, and customize data collection settings to ensure compliance and respect user privacy.
Overall, the GA4 data model enables you to gain deeper insights into user behavior, optimize marketing strategies, and make data-driven decisions to improve your business outcomes.
Setting up Google Analytics Account & Google Analytics Property
There is no doubt Google Analytics 4 is an essential tool to keep your business growing upward. In this section of the article, we'll show how you can set up a Google Analytics account and a Google Analytics property.
Create a Google Analytics Account for Your Online Business
Visit the Google Analytics website (https://analytics.google.com) and sign in using your existing Google Account credentials.
You must have a Google Account, to start the Google Analytics account creation process.
If you already have a Google Analytics account and are just trying to create a new property in Google Analytics 4, then you can jump to creating a property.
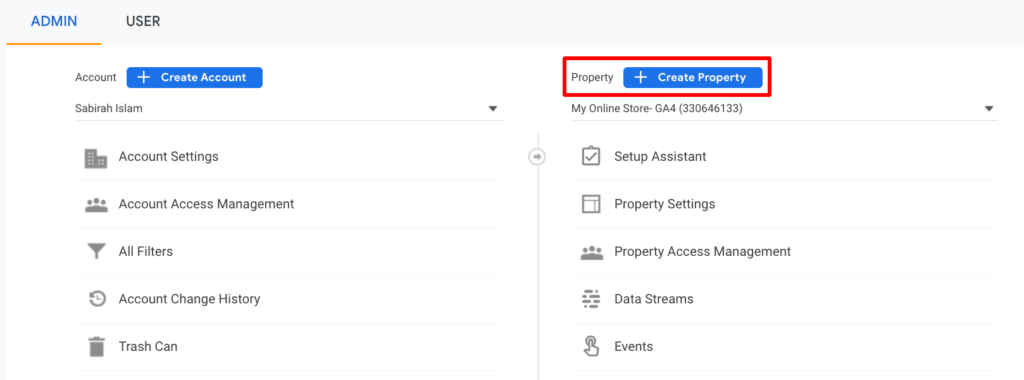
From Google Analytics Home page, click Admin. You'll find the option at the bottom left of the page.
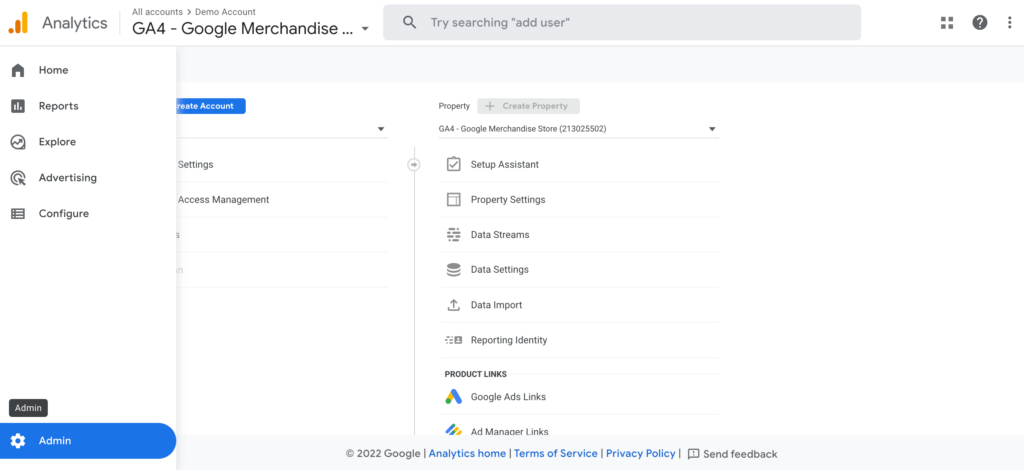
The Admin page of Google Analytics and Universal Analytics are not similar. They have different properties and attributes.
For example, you'll see a Property column for the Google Analytics 4 Admin page that includes a link for Data Streams. This was not available on the Universal Analytics Admin page.
Also, there was a third column for Views on the Universal Analytics Admin page. But you'll not find this column anymore in Google Analytics 4.
Now follow the steps below to configure your Google Analytics 4 account-
- Under the Account column, click Create Account
- Insert an account name
- Configure the data-sharing settings to define which data you'll share with Google
- Finally, add the first property to the account by clicking Next.
Create a New Google Analytics 4 Property
You must have the Editor role to add properties to a Google Analytics account. However, if you created this account, you automatically get the Editor role.
To create a new Google Analytics 4 property, follow these steps:
Are you continuing from “Create an Analytics account”, above? Then, start from step 2.
Step 1: Access the Admin settings. Hit the button “Create Property” from the Property column.
Step 2: Enter the property details (Name, Time Zone, Currency). Click Next.
Step 3: Select your industry category and business size. Click Next.
Step 4: Select how you intend to use Google Analytics.
Step 5: Review the details and click “Create” to create the property.
In order to start collecting data, you need to Add a data stream.
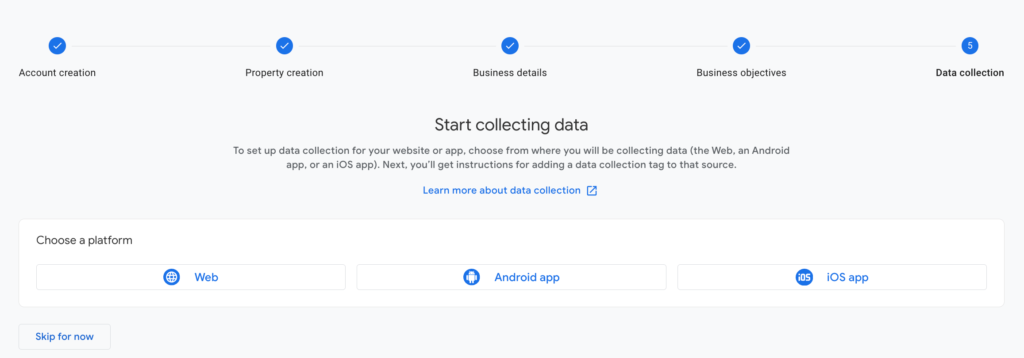
You can make the choice here or skip it for now. Next, we'll show you how to add a data stream from your Admin page.
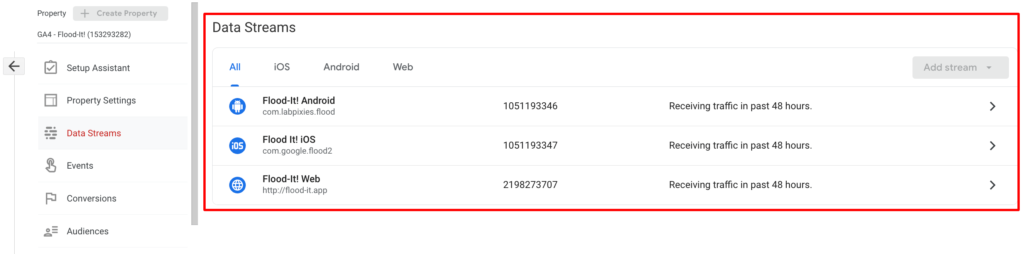
Add a Data Stream
It's important to check that you select the right account under the Account column.
Also, confirm that you select the right property from the Property column.
Now, in the Property column, click Data Streams → Add stream.
Choose based on your requirements- iOS app, Android app, or Web.
For any confusion, you can contact us or check the Google official document on [GA4] Set up Analytics for a website and/or app.
Understanding Reports in Google Analytics 4
Google Analytics 4 is especially known for its advanced report system. Let's show you how to check different metrics on GA4 so you can use them for upgrading your marketing strategies.
After landing on the Google Analytics homepage you'll get a view like-
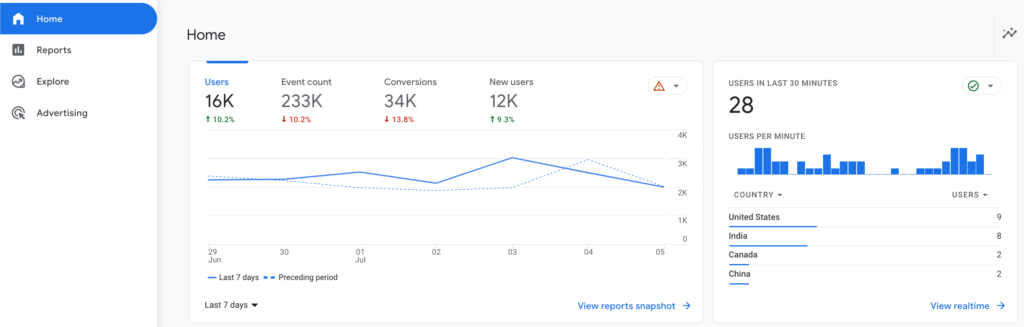
On top, you have the name of the account and the property you are in. By clicking on the arrow you can see your account and property selector here. Simply select an account or property you want to view the data for.
Get back to the homepage after selecting the account and the property.
On the left-hand side, you can find the main navigation of the property you are in.
Realtime Overview on Google Analytics 4
By default the home screen appears with a snapshot of the past seven days of data as well as some real-time activity.
Click on the “Realtime Overview”
Here, you can get a complete overview of what's happening on your site and mobile app. It starts with a map showing you the location of your users currently on your website.
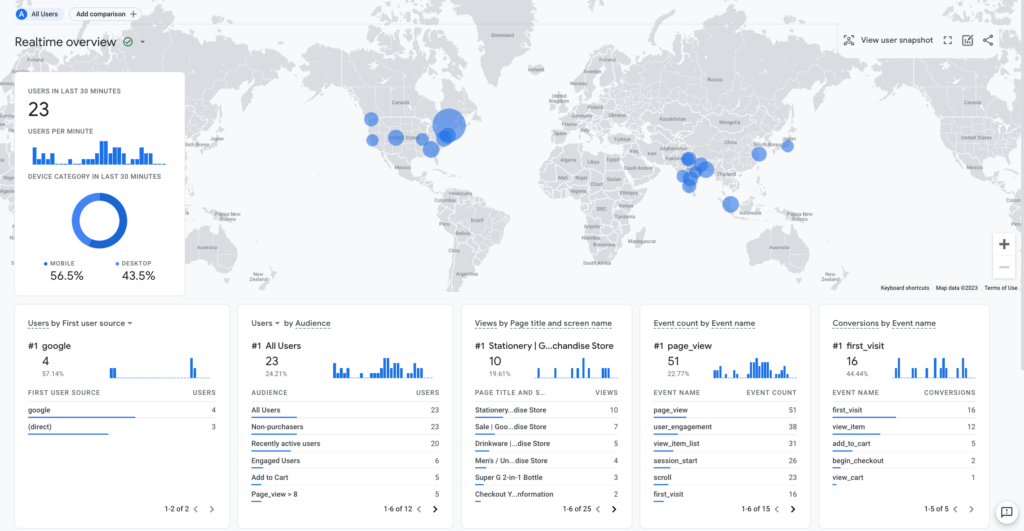
Real-Time reports are very useful to diagnose problems in real time or see the impacts of any particular event.
For example, you launch a new campaign and you want to see how it's performing.
You can check Real-Time Reports and see if users are coming from that campaign and their actions on your site.
Similarly, when you make changes to your tracking, let's say you implement a new tag or new event tracking. You can check immediately if that event is getting fired and whether Google Analytics is collecting that data.
Life Cycle Report on Google Analytics 4
Under Realtime, you'll find another important tab called Life Cycle.
There are several stages of the customer life cycle.
These stages help you understand how users interact with your business from the moment they discover your website or app to the point of conversion or churn.
The first stage is the acquisition, getting users or customers on your website or app.
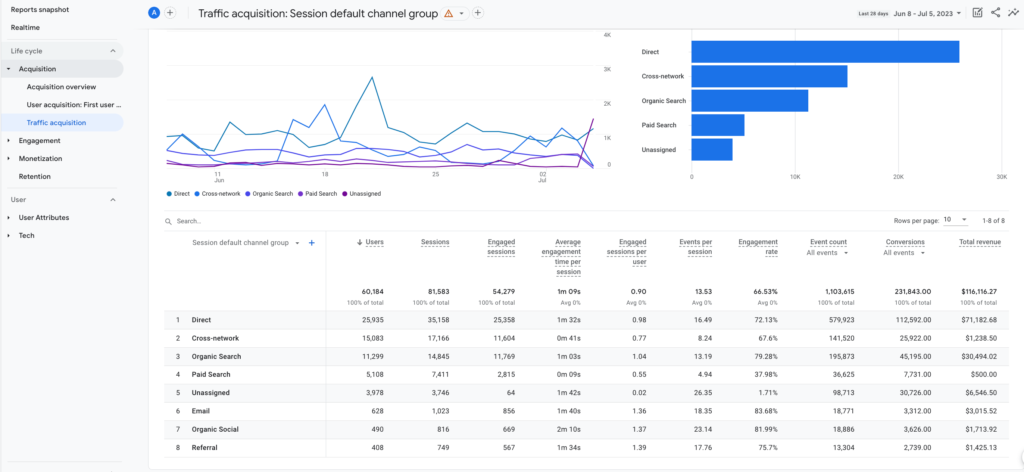
This report shows you the source and medium through which users discover your website or app. Such as organic search, paid advertising, social media, or referrals.
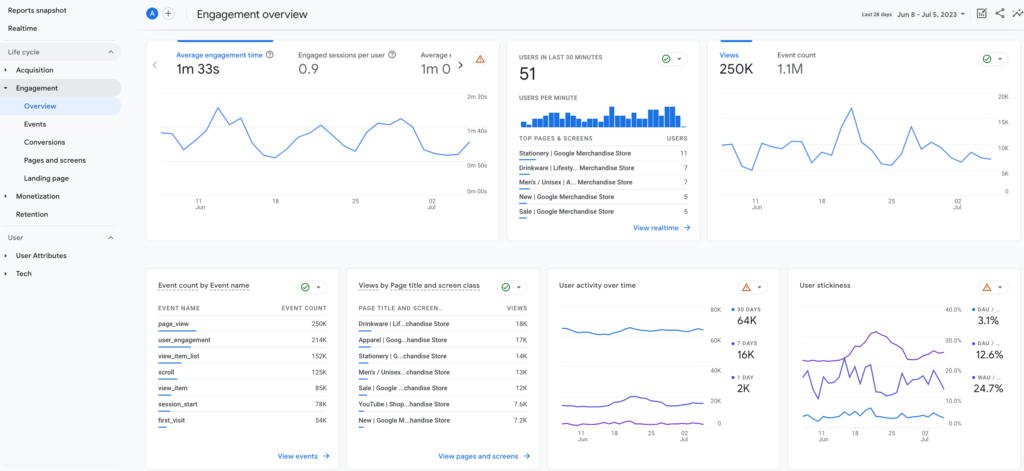
Once users have acquired, the engagement stage measures how they interact with your website or app. It includes metrics like session duration, page views, events triggered, and screen views (for mobile apps). This stage helps you understand user behavior and their level of engagement.
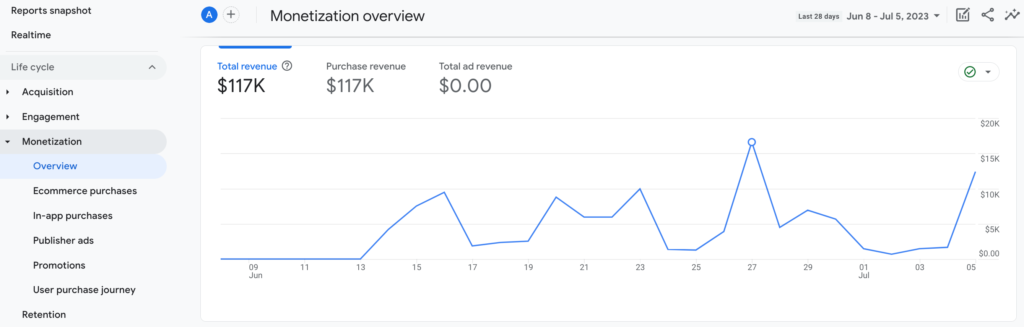
The next option is Monetization. This is all about eCommerce.
If your site sells products, then you'll find all the data related to eCommerce activity and purchases in this section.
Then finally, you have retention. This is the last stage of your customer life cycle.
A retention report measures how well you are able to keep users engaged and returning to your website or app over time. It provides insights into user loyalty and recurring engagement.
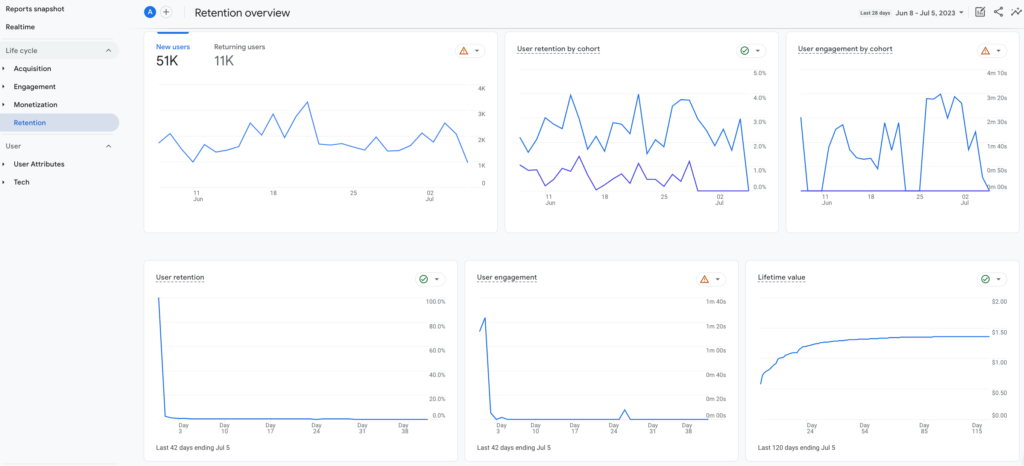
Monitoring retention rates and behavior can help you identify strategies to retain users and improve customer lifetime value.
User Report on Google Analytics 4
Next, you get the user section. Here you'll find all the details about your users. You can see the demographics of these users, such as the country, city, gender, interest, and age.
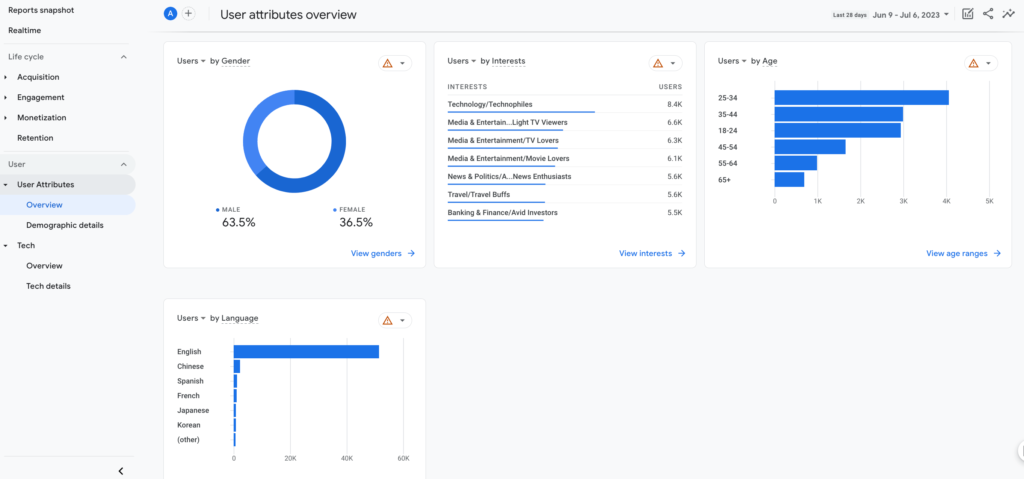
You can use these data to
- Create personalized marketing campaigns
- Provide personalized product recommendations
- Segment your email marketing campaigns
- Identify valuable customer group
For example, you find a user base of “Women in the 25-34 age group” on your report. Now, you can highlight products that are popular among this specific segment or create targeted campaigns promoting products or offers tailored to their interests.
Then comes the tab Tech. From the Tech you can check what technology these users are using to visit your site. Such as the platform they are using, whether it's Web or app, then the operating system, browser device, etc.
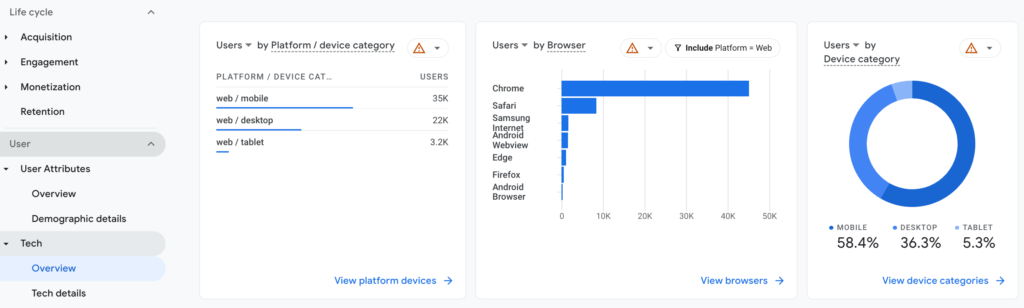
By analyzing the data provided, you can identify any technical issues that may be impacting the user experience and take appropriate actions to resolve them.
For example, you notice a high bounce rate among visitors using a specific device. It could indicate compatibility issues. You can then optimize your website to ensure it functions well on that particular device. It would be helpful to improve the user experience and reduce bounce rates.
Planning to build your eCommerce store using WooCommerce? Check how to make your WooCommerce site mobile-ready with 9 simple steps.
Things You Should Know to Operate Google Analytics 4 Smoothly
Google Analytics 4 introduces several new features and improvements over its predecessor. Initially, it might be challenging to get habituated to the new interface of Google Analytics. But once you start utilizing the benefits, it will amaze you with exclusive results.
Below we've listed some core concepts of GA4 so you can easily use this tool for your online store-
Event Tracking in Google Analytics 4
Event tracking is a critical component of GA4. GA4 provides several predefined events that cover common user interactions, such as page views, clicks, video views, etc.
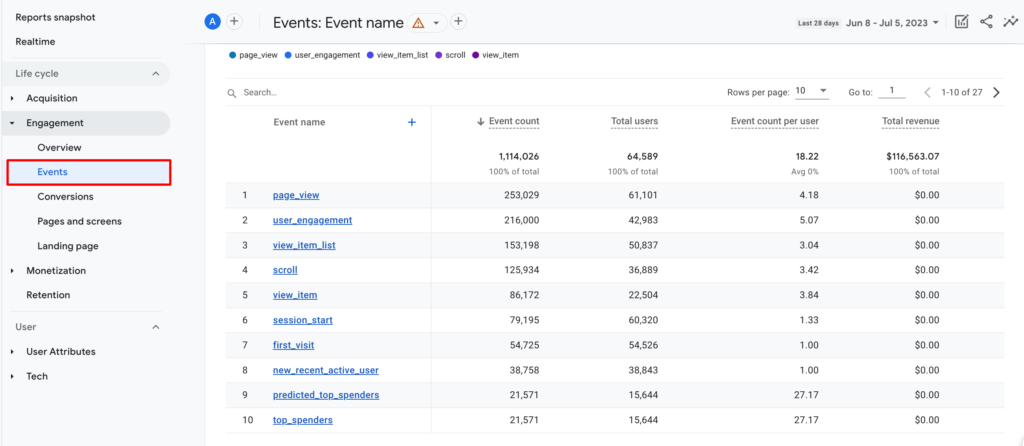
You can also define custom events to track specific user interactions that are relevant to your business.
In GA4, events are organized into event categories, such as page_view and scroll. Each event category has predefined parameters that capture information about the event, such as the page URL and the scroll depth.
GA4 gives you the flexibility to create custom parameters as well. So, you can capture additional information about the event, such as the product name or the button label.
New Properties in Google Analytics 4
One major change that comes in Google Analytics 4 is the management process of “properties”.
In Universal Analytics, you need to create an individual property for each of your online entities. Such as iOs app – property, Android app – property, and Website – property. Users typically use views and filters to adjust reports and configure data collection as per the requirements.
But inside GA4, you'll get a single Analytics property that contains data streams. Data streams handle all the GA4 properties collectively. It pulls data from an online entity and pushes it into your property.
Here, you'll get a single data stream for your website, Android app, and iOS app to measure and compare user behavior across different platforms.
You can apply one or multiple of these data sources within a single GA4 property. Each property can contain up to 50 data streams.
It gives you options to adjust how you track and view your data from each stream applying filters to your report. The new data stream mitigated the need for views.
Advanced Path Exploration Features in Google Analytics 4
Path exploration in Google Analytics 4 is a powerful tool for analyzing user behavior and understanding how users interact with your website or app. By tracking the paths that users take, you can gain insights into their preferences, interests, and motivations.
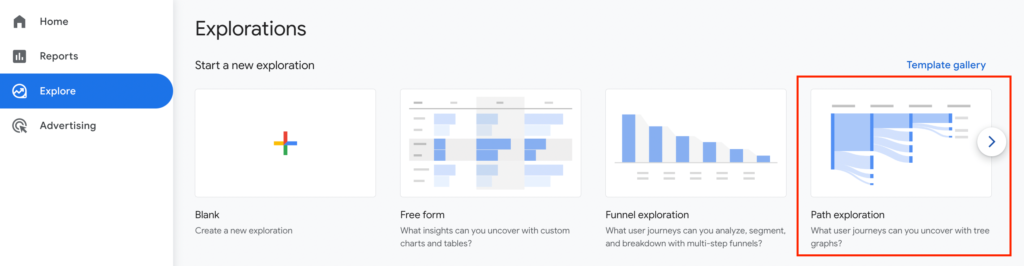
For example, by analyzing the flow reports, you can identify popular entry points to your website or app. This can help you optimize those entry points to provide a better user experience and increase conversions.
Similarly, by analyzing the drop-off points in the user journey, you can identify areas for improvement and take steps to reduce the drop-off rate.
Path exploration can also help you understand the effectiveness of your marketing campaigns.
By tracking the paths that users take after clicking on a specific ad or campaign, you can measure the impact of your marketing efforts and make data-driven decisions on where to allocate your resources.
Also Read: An Easy Guide to Google Conversion Tracking (Both Analytics & Ads).
Troubleshooting: Common Issues While Setting Up GA4
Despite your best efforts, you might face some issues while setting up GA4. But don't worry, here are some common issues and how to troubleshoot them.
One common issue is not seeing data in your GA4 reports. This could be due to various reasons like incorrect setup of data streams or tracking code, filters blocking data, etc.
Make sure your tracking code is correctly installed, data streams are properly set up, and no filters are blocking your data.
Another common issue is discrepancies between UA and GA4 data. This is normal due to the different data models and methodologies used by UA and GA4.
However, if the discrepancies are significant, it could be due to issues like missing or double-tracking events, different attribution models, etc. Make sure your events are correctly set up, and understand the other attribution models used by UA and GA4.
FAQs on GA4 eCommerce
As an eCommerce business owner, harnessing the power of data analytics is crucial for success in the digital landscape. GA4 empowers you with advanced analytics capabilities specifically designed for eCommerce websites.
From tracking user behavior to optimizing marketing campaigns, GA4 provides the tools you need to elevate your eCommerce success. Embrace the future of eCommerce analytics with GA4 and unlock new opportunities for growth and profitability.
In Google Analytics 4 (GA4), ecommerce data is obtained through the implementation of enhanced measurement and event tracking.
Using new features of GA4, businesses can easily track various actions on their website that are crucial for measuring ecommerce success, such as product views, add-to carts, and purchases.
For example, when a user adds a product to their cart or completes a purchase, GA4 captures these events and attributes them to specific users or sessions. These detailed event-tracking capabilities allow businesses to analyze customer behavior patterns and optimize their online stores accordingly.
Follow the below steps for setting up event tracking in GA4-
1. Identify the key eCommerce events that are most relevant to your business.
2. Configure event parameters including product details, transaction values, & others
3. Implement event tracking code
4. Test and validate event tracking
5. Continuously monitor & optimize your tracking implementation

Monitor GA4 eCommerce Data to Lead a Successful Digital Business
Doing an eCommerce business at this time becomes extremely challenging for any type of niche. To survive in this competitive industry you must deliver something exclusive. Most importantly, you have to take good care of your customers. And to make your user journey remarkable, you need a better understanding of your customers' expectations and behaviors.
In a nutshell, to run a successful online business you need information about-
- How customers behave while visiting your website
- And what you can do to improve their journey.
Google Analytics 4 makes this process easier for you.
Google Analytics 4 is not just an upgraded version of Universal Analytics. This is the new generation of Google Analytics.
GA4 provides better cross-platform tracking by allowing you to measure user interactions across websites, mobile apps, and other digital platforms. This helps you gain a comprehensive view of user engagement and understand the impact of different marketing channels on user behavior.
Moreover, its user-centric approach, advanced machine-learning capabilities, and flexible data model provide a lot of advantages. However, to truly master GA4, you need to continually explore, learn, and adapt.
Remember, the goal is not just to collect data, but to turn this data into actionable insights that drive your eCommerce success.
Have you any further queries about GA4 eCommerce? Do use the comment section below!